Category: AWS Deployments

A technical reference for deploying infrastructure and applications on AWS. Each post in this category covers a specific deployment topic end-to-end — from writing the first line of infrastructure code to running production-grade workloads — using tools like AWS CDK, AWS SAM, AWS CLI, and CloudFormation. Whether you are deploying Lambda functions, ECS clusters, API Gateways, or VPC stacks, every post walks through the deployment lifecycle with real commands, real configuration, and the operational patterns that separate working prototypes from production systems.

  • Building systems in AWS

    Building systems in AWS

    Deciding Requirements

    My first system on AWS had everything planned from day one. Authentication, notifications, retry logic, multiple user roles. It took weeks to build something I could barely test because nothing worked independently. Everything was connected before anything was verified.

    The right question before picking any service is: what does this system have to do to exist at all. Not eventually — right now.

    For a chatbot that is four things: accept a message, generate a reply using a language model, remember the conversation, know who is talking. Everything else — multiple agents, model switching, saved prompts, persistent memory, workflow triggers — does not define the system. These are features that sit on top of it.

    Write the core requirements down before opening the AWS console. The moment you skip it, you end up designing two systems at once: the one you need and the one you think you might need.

    The additional features I had in mind for this chatbot were: private VPC calls between services, saved custom prompts, a persistent memory that loads at the start of each session, model selection with mid-conversation switching and full context transfer, and workflow trigger support. None of these need to exist for the chatbot to work. All of them can be added to a working core without touching what is already running.

    Build the core until it works. Then build the next thing around it.


    Selecting the Components

    Once the core requirements are written down, each one maps to a service. The goal is not the most powerful service for each requirement — it is the simplest one that works at the expected scale.

    For the chatbot, the four requirements map like this.

    Accepting messages needs an HTTP endpoint. API Gateway handles this. There are two options — REST API and HTTP API. HTTP API is cheaper and simpler, and for just receiving a message and forwarding it to a Lambda function, it is enough. REST API makes sense when you need request validation, caching, or usage plans built in.

    Generating a reply needs a language model. Amazon Bedrock gives access to foundation models — Claude, Llama, Titan, and others — without managing any infrastructure. Pricing is on-demand per token, so there is no upfront commitment while traffic is still unpredictable. The model you pick matters for cost — smaller models cost significantly less than larger ones, so starting with the cheaper option and moving up only where response quality requires it is the sensible default.

    Storing conversation history needs a database, and the main options are DynamoDB, RDS, or keeping history in memory — in-memory storage disappears when the function restarts, RDS adds a VPC, subnet group, connection management, and a running instance you pay for whether it is used or not, while DynamoDB charges per request, has no infrastructure to maintain, and fits the access pattern of reading a user’s history and appending to it.

    Compute to connect everything is Lambda. It receives the request, fetches history, calls Bedrock, writes the result back, and returns the response. Authentication is Cognito, which handles sign-up, sign-in, and token issuance — API Gateway validates the token before the request reaches Lambda, so unauthenticated requests never consume compute.


    Creating the Architecture

    I started with Lambda. Not because it was the most important piece but because it is the thing everything else connects to — once the function exists and is processing requests correctly, attaching Bedrock, DynamoDB, and API Gateway to it is straightforward. The first thing that broke was the Lambda configuration itself, which was not set up to process JSON requests, so calls from the terminal were failing before any other service was even involved. Finding that before wiring everything else together saved time.

    The request path once everything is connected is: a user sends a POST request to the API Gateway endpoint, which validates the Cognito JWT token and rejects anything unauthenticated before it reaches Lambda, which then pulls the user’s conversation history from DynamoDB, passes it along with the new message to Bedrock, gets a reply, writes both the message and the reply back to DynamoDB, and returns the response.

    That is the entire core system running end to end. Once it is working, the additional features attach to specific points in this path without changing what is already there — VPC for private calls slots in at the networking layer, model selection adds a parameter to the Bedrock call, etc. If the architecture needs to evolve further, moving toward an event-driven model using EventBridge reduces coupling between components without requiring a rewrite of anything already working.


    Setting Up Troubleshooting

    Since this was a local example and never went to production, the monitoring setup was lightweight — API call tracking on Lambda, DynamoDB, and Bedrock to watch what was being invoked and how often.

    For a system that does go to production, CloudWatch is the right place to start. Each service in the stack exposes its own logs and metrics, and having those in one place means that when something goes wrong, you are not hunting across different tools to piece together what happened. Structured JSON logging inside the Lambda function — userId, message length, execution time, etc. — makes logs easier to search and filter when something goes wrong.

    Alarms on the key metrics — errors, duration, error rates on the API, etc. — catch problems before users report them. Each service in the stack exposes its own metrics in CloudWatch, and setting alarms on the ones that matter for your specific system gives you enough visibility to know when something is wrong and roughly where to look.

  • Configuring CloudWatch Alarms and Log Groups

    Configuring CloudWatch Alarms and Log Groups

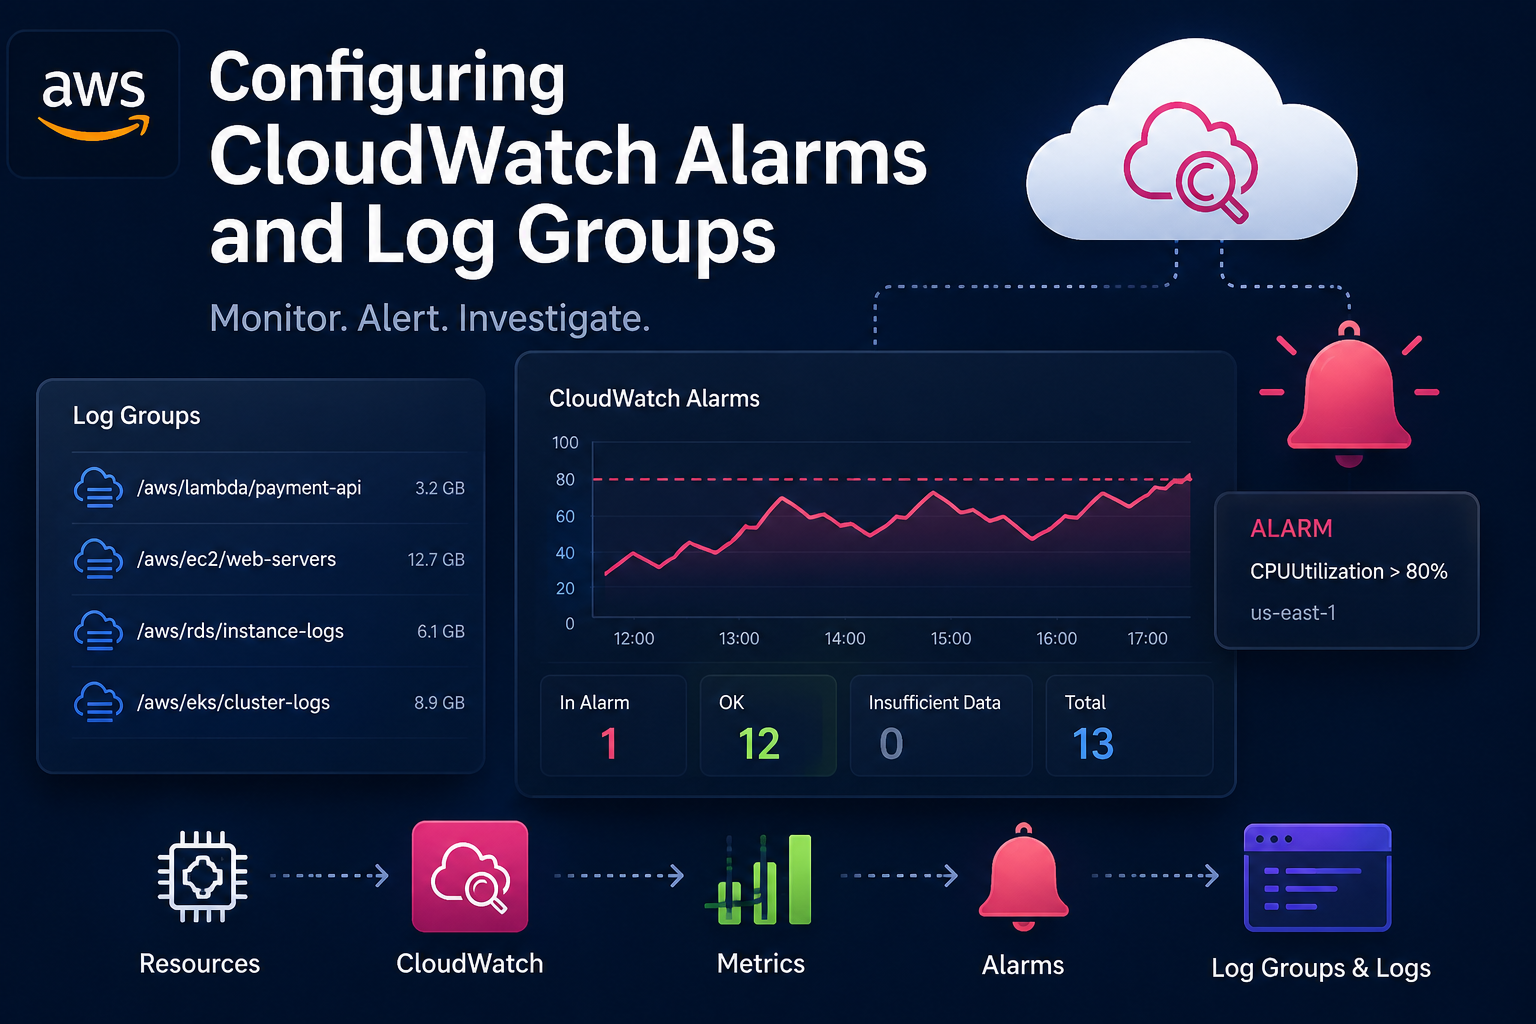
    CloudWatch is the monitoring layer that most AWS workloads eventually depend on, whether the team planned for it or not. EC2 sends CPU metrics to it, Lambda writes logs to it, API Gateway exposes error rates through it, ECS services can be watched through it, and almost every production incident ends with someone opening CloudWatch to answer the same questions: what changed, when did it start, and why did nobody get alerted earlier?

    Configuring CloudWatch alarms and log groups correctly is not complicated, but it is easy to leave half-finished. A log group gets created automatically with no retention policy. An alarm gets created with a threshold that looked reasonable at the time. Missing data is left at the default. Notifications are wired to a topic nobody is subscribed to. Everything looks fine until the first real outage, when the dashboard is quiet and the logs are expensive.

    A production CloudWatch setup should do three things well: keep logs long enough to investigate problems, delete logs before they become a permanent bill, and alert on symptoms that actually matter. The setup below focuses on those basics.


    Create Log Groups Intentionally

    Many AWS services create CloudWatch log groups automatically. Lambda creates one when a function writes logs for the first time. API Gateway, ECS, Step Functions, and other services can also create or write to log groups depending on how logging is configured. Automatic creation is convenient, but it usually means the log group appears with default settings and no deliberate retention policy.

    For production systems, create log groups intentionally before the service starts writing to them. That gives you control over the name, retention period, encryption, tags, and log class from the beginning.

    aws logs create-log-group \
      --log-group-name /aws/app/orders-api \
      --region us-east-1

    A consistent naming convention matters more than it looks. CloudWatch log groups become hard to manage when every service uses a different pattern. A useful convention is to include the platform, application, and environment:

    /aws/app/orders-api/prod
    /aws/app/orders-api/staging
    /aws/lambda/payment-worker/prod
    /aws/ecs/catalog-service/prod
    /aws/apigateway/public-api/prod

    If a log group already exists, the create command fails with a resource already exists error. That is not a problem. In infrastructure-as-code workflows, the log group should be managed by Terraform, CloudFormation, CDK, or whatever you use to keep production from becoming a collection of console clicks.

    If you let a service create the log group automatically, go back immediately and apply retention, encryption, and tags. Automatic creation should not mean automatic neglect.


    Set Retention Before Logs Accumulate

    By default, CloudWatch Logs stores log data indefinitely. That sounds safe until a busy application starts writing debug logs, access logs, request payloads, stack traces, retries, and health check noise for months. Logs are useful during incidents, but old logs with no retention policy quietly become a storage bill.

    Set a retention period on every production log group:

    aws logs put-retention-policy \
      --log-group-name /aws/app/orders-api/prod \
      --retention-in-days 30 \
      --region us-east-1

    The correct retention period depends on the workload. Application logs used for debugging might only need 14 or 30 days. Security, audit, and compliance logs might need 90 days, 180 days, one year, or longer. The important part is to choose deliberately instead of leaving the setting at never expire.

    Log Type Common Retention Reason
    Application debug logs 7-30 days Useful for recent incidents, usually noisy after that
    API access logs 30-90 days Useful for traffic analysis, abuse investigation, and debugging
    Security or audit logs 90-365+ days Often driven by compliance and investigation requirements
    Temporary development logs 1-7 days Should not become a permanent cost center
    Archived incident logs Export to S3 Better suited for long-term retention and cheaper storage controls

    CloudWatch Logs does not always delete expired log events immediately when they reach the retention date. Deletion typically happens later, so do not assume the storage number drops the second you update the retention policy.

    If you shorten retention from 365 days to 30 days, older events become eligible for deletion. If you change the setting back to a longer period before deletion finishes, some old data may remain longer than expected. For strict deletion requirements, keep the shorter retention setting in place until the old data has actually aged out.


    Choose the Log Class Carefully

    CloudWatch Logs supports log classes. The Standard class supports the full CloudWatch Logs feature set. Infrequent Access is lower-cost for logs that are accessed less often, but it supports only a subset of features. There is also a Delivery class used for delivering Lambda logs to Amazon S3 or Firehose, with limited CloudWatch Logs capabilities.

    The important production detail is that the log class is chosen when the log group is created. After a log group is created, its class cannot be changed. That means this decision belongs in the setup step, not later when the bill arrives.

    aws logs create-log-group \
      --log-group-name /aws/app/audit-events/prod \
      --log-group-class INFREQUENT_ACCESS \
      --region us-east-1

    Use Standard when you need metric filters, subscription filters, real-time processing, Live Tail, Container Insights log ingestion, Lambda Insights log ingestion, or full operational visibility. Use Infrequent Access when logs are mostly kept for after-the-fact investigation and you do not need the unsupported features.

    If you plan to create alarms from logs using metric filters, use Standard. Metric filters are not supported on Infrequent Access log groups. Creating the cheaper class first and discovering this later is a migration problem, not a setting change.


    Encrypt Sensitive Log Groups With KMS

    CloudWatch Logs encrypts log data by default, but production systems that handle regulated or sensitive data often need encryption with a customer managed KMS key. You can associate a KMS key with a log group so newly ingested data is encrypted with that key.

    aws logs associate-kms-key \
      --log-group-name /aws/app/orders-api/prod \
      --kms-key-id arn:aws:kms:us-east-1:123456789012:key/11111111-2222-3333-4444-555555555555 \
      --region us-east-1

    The KMS key policy must allow CloudWatch Logs to use the key. A typical key policy statement allows the regional CloudWatch Logs service principal to encrypt and decrypt data for the account. Replace the region, account ID, and key ARN with your actual values:

    {
      "Sid": "AllowCloudWatchLogsUseOfKey",
      "Effect": "Allow",
      "Principal": {
        "Service": "logs.us-east-1.amazonaws.com"
      },
      "Action": [
        "kms:Encrypt",
        "kms:Decrypt",
        "kms:ReEncrypt*",
        "kms:GenerateDataKey*",
        "kms:DescribeKey"
      ],
      "Resource": "*",
      "Condition": {
        "ArnLike": {
          "kms:EncryptionContext:aws:logs:arn": "arn:aws:logs:us-east-1:123456789012:log-group:/aws/app/orders-api/prod"
        }
      }
    }

    If the key policy is wrong, log ingestion or log reading can fail. The symptom may look like the application is not logging, but the real issue is that CloudWatch Logs cannot use the key correctly. Test this early by writing a sample log event and reading it back.

    If you associate a KMS key after logs already exist, newly ingested data uses the key. Existing data remains associated with whatever encryption configuration applied when it was written.


    Create an SNS Topic Before the Alarm

    An alarm without a working notification path is just a dashboard decoration. For most teams, the simplest starting point is an SNS topic with email, Slack, PagerDuty, Opsgenie, or another incident tool subscribed to it.

    aws sns create-topic \
      --name production-alerts \
      --region us-east-1

    Subscribe an email address while testing:

    aws sns subscribe \
      --topic-arn arn:aws:sns:us-east-1:123456789012:production-alerts \
      --protocol email \
      --notification-endpoint [email protected] \
      --region us-east-1

    The email subscription must be confirmed before notifications are delivered. This is one of the easiest things to miss. The alarm can be perfect, the SNS topic can be correct, and the notification can still go nowhere because the subscription is pending confirmation.

    If your team uses an incident management tool, connect SNS to that tool instead of relying on a shared inbox. Email is fine for low-priority alerts. It is usually not enough for incidents that need someone awake and responding.


    Create a Basic Metric Alarm

    A CloudWatch alarm watches a metric and changes state when the metric breaches the configured threshold. The three alarm states are OK, ALARM, and INSUFFICIENT_DATA. The alarm evaluates metric datapoints over one or more periods and changes state based on the threshold, comparison operator, evaluation periods, datapoints to alarm, and missing data behavior.

    A common EC2 alarm watches average CPU utilization for a specific instance:

    aws cloudwatch put-metric-alarm \
      --alarm-name prod-web-01-high-cpu \
      --alarm-description "EC2 CPU utilization is above 80% for 10 minutes" \
      --namespace AWS/EC2 \
      --metric-name CPUUtilization \
      --dimensions Name=InstanceId,Value=i-0123456789abcdef0 \
      --statistic Average \
      --period 300 \
      --evaluation-periods 2 \
      --datapoints-to-alarm 2 \
      --threshold 80 \
      --comparison-operator GreaterThanThreshold \
      --treat-missing-data notBreaching \
      --alarm-actions arn:aws:sns:us-east-1:123456789012:production-alerts \
      --ok-actions arn:aws:sns:us-east-1:123456789012:production-alerts \
      --region us-east-1

    This alarm uses a five-minute period and requires two out of two datapoints to breach. In practice, that means CPU must remain above 80% for about ten minutes before the alarm moves to ALARM. A single short spike will not trigger it.

    If the workload is latency sensitive, ten minutes may be too slow. If the metric is naturally noisy, ten minutes may be too fast. The threshold should come from normal operating behavior, not a random number that looks serious.

    For Lambda, an error alarm might look like this:

    aws cloudwatch put-metric-alarm \
      --alarm-name prod-payment-worker-errors \
      --alarm-description "Lambda payment worker has errors" \
      --namespace AWS/Lambda \
      --metric-name Errors \
      --dimensions Name=FunctionName,Value=payment-worker-prod \
      --statistic Sum \
      --period 300 \
      --evaluation-periods 1 \
      --datapoints-to-alarm 1 \
      --threshold 0 \
      --comparison-operator GreaterThanThreshold \
      --treat-missing-data notBreaching \
      --alarm-actions arn:aws:sns:us-east-1:123456789012:production-alerts \
      --region us-east-1

    This alarm triggers when Lambda reports more than zero errors in a five-minute period. That may be appropriate for payment processing. It may be too noisy for a batch job that retries safely. The same AWS service metric can require different alarm settings depending on the business impact.


    Understand Evaluation Periods and Datapoints to Alarm

    The two fields that decide how quickly an alarm triggers are EvaluationPeriods and DatapointsToAlarm. Together, they define an M out of N alarm.

    If both values are the same, every datapoint in the evaluation window must breach. If EvaluationPeriods is 3 and DatapointsToAlarm is 3, the alarm needs three consecutive breaching datapoints.

    If DatapointsToAlarm is lower than EvaluationPeriods, the alarm can tolerate some non-breaching datapoints. If EvaluationPeriods is 5 and DatapointsToAlarm is 3, the alarm triggers when three of the last five datapoints breach.

    aws cloudwatch put-metric-alarm \
      --alarm-name prod-api-5xx-rate \
      --alarm-description "API has sustained 5xx errors" \
      --namespace AWS/ApiGateway \
      --metric-name 5XXError \
      --dimensions Name=ApiName,Value=public-api Name=Stage,Value=prod \
      --statistic Sum \
      --period 60 \
      --evaluation-periods 5 \
      --datapoints-to-alarm 3 \
      --threshold 10 \
      --comparison-operator GreaterThanThreshold \
      --treat-missing-data notBreaching \
      --alarm-actions arn:aws:sns:us-east-1:123456789012:production-alerts \
      --region us-east-1

    This is useful for noisy metrics. Three bad minutes out of five is usually more meaningful than one bad minute, but it still catches a real problem faster than waiting for five consecutive bad datapoints.

    If you are alerting on something that should never happen, such as payment failures, one datapoint may be enough. If you are alerting on saturation, such as CPU, memory, queue depth, or connection count, require multiple datapoints so transient spikes do not page people unnecessarily.


    Handle Missing Data Deliberately

    Missing data is one of the most important alarm settings because not every metric publishes continuously. Some metrics only appear when there is activity. Some custom metrics stop reporting when the application breaks. Some AWS service metrics are sparse by design.

    CloudWatch supports these missing data options:

    Setting Meaning Typical Use
    breaching Treat missing datapoints as bad Heartbeat metrics that must always report
    notBreaching Treat missing datapoints as good Error metrics that only publish when errors happen
    ignore Keep the current alarm state Metrics where missing data should not change state
    missing Use CloudWatch default missing-data behavior Only when you have verified it fits the metric

    For an error-count metric, notBreaching is often correct. If there are no errors, some services may publish no datapoint. You do not want the alarm to enter ALARM just because nothing bad happened.

    For a heartbeat metric, breaching is usually correct. If your application publishes Heartbeat=1 every minute and that metric disappears, the missing datapoint is the incident.

    aws cloudwatch put-metric-alarm \
      --alarm-name prod-worker-heartbeat-missing \
      --alarm-description "Worker heartbeat stopped reporting" \
      --namespace Custom/App \
      --metric-name WorkerHeartbeat \
      --dimensions Name=Service,Value=payment-worker Name=Environment,Value=prod \
      --statistic Minimum \
      --period 60 \
      --evaluation-periods 3 \
      --datapoints-to-alarm 3 \
      --threshold 1 \
      --comparison-operator LessThanThreshold \
      --treat-missing-data breaching \
      --alarm-actions arn:aws:sns:us-east-1:123456789012:production-alerts \
      --region us-east-1

    If this alarm uses notBreaching, it can fail silently when the worker dies and stops publishing metrics. That is the exact failure mode a heartbeat alarm is supposed to catch.

    For DynamoDB metrics, be careful with assumptions. CloudWatch alarms that evaluate metrics in the AWS/DynamoDB namespace always ignore missing data even if you choose a different setting. That behavior matters when designing alarms around sparse DynamoDB metrics.


    Build Alarms From Logs With Metric Filters

    Not every useful signal exists as a built-in CloudWatch metric. Sometimes the important event is only visible in application logs: a payment failed, a downstream provider timed out, a user received a 403, or a background job retried too many times.

    Metric filters turn matching log events into CloudWatch metrics. Once the metric exists, you can alarm on it like any other metric.

    For example, assume the application logs JSON events like this:

    {
      "level": "error",
      "service": "orders-api",
      "event": "checkout_failed",
      "reason": "payment_provider_timeout",
      "requestId": "8d42f9"
    }

    Create a metric filter that counts checkout failures:

    aws logs put-metric-filter \
      --log-group-name /aws/app/orders-api/prod \
      --filter-name checkout-failures \
      --filter-pattern '{ $.event = "checkout_failed" }' \
      --metric-transformations \
        metricName=CheckoutFailures,\
    metricNamespace=AWSBuilds/Orders,\
    metricValue=1,\
    defaultValue=0 \
      --region us-east-1

    Then create an alarm on the generated metric:

    aws cloudwatch put-metric-alarm \
      --alarm-name prod-orders-checkout-failures \
      --alarm-description "Checkout failures detected in application logs" \
      --namespace AWSBuilds/Orders \
      --metric-name CheckoutFailures \
      --statistic Sum \
      --period 300 \
      --evaluation-periods 1 \
      --datapoints-to-alarm 1 \
      --threshold 0 \
      --comparison-operator GreaterThanThreshold \
      --treat-missing-data notBreaching \
      --alarm-actions arn:aws:sns:us-east-1:123456789012:production-alerts \
      --region us-east-1

    This pattern is useful when the application already logs the event but does not publish a custom metric. It lets you create operational signals without changing application code immediately.

    Metric filters apply as log data is sent to CloudWatch Logs. They are not a replacement for searching historical logs. If you create the metric filter after yesterday’s incident, it will not backfill a metric for yesterday’s logs. Use Logs Insights for historical investigation and metric filters for ongoing monitoring.


    Avoid High-Cardinality Metric Filter Dimensions

    Metric filters can publish dimensions from JSON or space-delimited log events. Dimensions are useful, but they can also create a cost problem if the dimension value has too many unique values.

    This is safe because environment has a small number of possible values:

    aws logs put-metric-filter \
      --log-group-name /aws/app/orders-api/prod \
      --filter-name api-errors-by-environment \
      --filter-pattern '{ $.level = "error" }' \
      --metric-transformations \
        metricName=ApplicationErrors,\
    metricNamespace=AWSBuilds/Orders,\
    metricValue=1,\
    dimensions='{Environment=$.environment}' \
      --region us-east-1

    This is risky because request IDs are unique:

    aws logs put-metric-filter \
      --log-group-name /aws/app/orders-api/prod \
      --filter-name api-errors-by-request-id \
      --filter-pattern '{ $.level = "error" }' \
      --metric-transformations \
        metricName=ApplicationErrors,\
    metricNamespace=AWSBuilds/Orders,\
    metricValue=1,\
    dimensions='{RequestId=$.requestId}' \
      --region us-east-1

    Each unique dimension value can become a separate custom metric. Do not use request IDs, user IDs, IP addresses, session IDs, order IDs, or other high-cardinality values as metric dimensions. Use those fields in Logs Insights queries instead.

    If CloudWatch Logs sees a metric filter generating too many different dimension name-value pairs, it can disable the filter to prevent unexpected charges. That guard helps, but it is better to design the metric correctly in the first place.


    Use Logs Insights for Investigation

    Alarms tell you something is wrong. Logs tell you what happened. CloudWatch Logs Insights is useful for querying log groups during an incident without exporting logs somewhere else first.

    A basic query for recent errors:

    fields @timestamp, @message
    | filter level = "error"
    | sort @timestamp desc
    | limit 50

    A query to count errors by reason:

    fields @timestamp, reason
    | filter level = "error"
    | stats count(*) as errors by reason
    | sort errors desc

    A query to inspect slow requests if your logs include duration:

    fields @timestamp, path, statusCode, durationMs
    | filter durationMs > 1000
    | sort durationMs desc
    | limit 50

    You can start a Logs Insights query from the AWS CLI. Use epoch timestamps for the start and end time:

    aws logs start-query \
      --log-group-name /aws/app/orders-api/prod \
      --start-time 1735689600 \
      --end-time 1735693200 \
      --query-string 'fields @timestamp, @message | filter level = "error" | sort @timestamp desc | limit 50' \
      --region us-east-1

    Then fetch the results using the returned query ID:

    aws logs get-query-results \
      --query-id 12345678-1234-1234-1234-123456789012 \
      --region us-east-1

    Do not try to turn every investigation query into an alarm. Some queries are useful during debugging but too noisy for paging. Alarms should represent symptoms that need action. Logs Insights should help answer the follow-up questions.


    Test the Alarm Path

    After creating alarms, test the notification path. CloudWatch provides a way to temporarily set an alarm state. This is useful for confirming that the alarm action reaches SNS and that SNS reaches the actual recipient.

    aws cloudwatch set-alarm-state \
      --alarm-name prod-web-01-high-cpu \
      --state-value ALARM \
      --state-reason "Testing alarm notification path" \
      --region us-east-1

    This can trigger the alarm action. Use it carefully on alarms that perform operational actions such as stopping, rebooting, recovering, or scaling resources. For notification-only alarms, it is a practical way to confirm the full path works.

    After testing, CloudWatch reevaluates the alarm based on the real metric data and moves it back to the correct state. Do not use manual state changes as a long-term override. If an alarm is noisy, fix the alarm configuration.

    Check the alarm after creation:

    aws cloudwatch describe-alarms \
      --alarm-names prod-web-01-high-cpu \
      --region us-east-1

    Check the SNS subscriptions too:

    aws sns list-subscriptions-by-topic \
      --topic-arn arn:aws:sns:us-east-1:123456789012:production-alerts \
      --region us-east-1

    If the alarm enters ALARM but nobody receives a message, check whether the subscription is confirmed, whether the alarm action ARN is correct, whether the topic policy allows publishing, and whether the notification system connected to SNS is filtering or dropping the message.


    Tag Log Groups and Alarms

    Tags make CloudWatch resources easier to find, allocate costs, and control through IAM. At minimum, tag production log groups and alarms with application, environment, owner, and managed-by values.

    aws logs tag-resource \
      --resource-arn arn:aws:logs:us-east-1:123456789012:log-group:/aws/app/orders-api/prod \
      --tags Application=orders-api,Environment=prod,Owner=platform,ManagedBy=terraform \
      --region us-east-1

    For alarms, use tags when creating or updating them through infrastructure-as-code. If you manage alarms manually, tagging is still worth doing because the account will eventually have more alarms than anyone remembers creating.

    aws cloudwatch tag-resource \
      --resource-arn arn:aws:cloudwatch:us-east-1:123456789012:alarm:prod-web-01-high-cpu \
      --tags Key=Application,Value=orders-api Key=Environment,Value=prod Key=Owner,Value=platform \
      --region us-east-1

    If different teams share the same AWS account, tags become even more important. They let you answer basic questions quickly: who owns this alarm, which service writes to this log group, and can this be deleted?


    Common Failure Modes

    The most common CloudWatch mistake is creating an alarm that technically works but does not represent user impact. CPU above 80% is not always an incident. A queue growing for five minutes might be normal during a batch run. A single Lambda error might be expected if the function retries successfully. Alert on symptoms that require action.

    The second common mistake is missing data behavior. If a metric only reports when something happens, treating missing data as breaching can create false alarms. If a metric must always report, treating missing data as not breaching can hide an outage.

    The third mistake is leaving log groups without retention. This does not break production immediately, which is why it survives. It shows up later as cost growth that nobody can tie to one deploy.

    The fourth mistake is relying only on log alarms. Logs are useful, but built-in service metrics are usually more direct for availability and saturation. Use service metrics for the main alarm path and log-based metrics for business events or application-specific failures.

    The fifth mistake is not testing the notification path. An alarm that points to an SNS topic with no confirmed subscription is not an alarm. It is an optimistic configuration file.


    Final Thoughts

    CloudWatch does not need an elaborate setup to be useful. It needs a deliberate one. Create log groups with names that make sense. Set retention before logs pile up. Pick the log class based on features, not just price. Encrypt sensitive log groups with KMS when required. Create alarms that match real failure modes. Treat missing data based on the metric’s behavior. Test the notification path before an incident tests it for you.

    A practical production baseline looks like this:

    • Create important log groups before services start writing to them
    • Apply retention to every log group
    • Use Standard log class when you need metric filters or real-time log features
    • Use Infrequent Access only for logs that do not need the unsupported features
    • Use KMS encryption for sensitive or regulated log data
    • Create SNS topics and confirm subscriptions before wiring alarms
    • Use M out of N alarms to reduce noise on spiky metrics
    • Set missing data behavior intentionally for every alarm
    • Use metric filters for important application events found in logs
    • Avoid high-cardinality dimensions in custom metrics
    • Test alarm notifications after deployment

    The best CloudWatch setup is the one that tells you about real problems early, keeps enough logs to investigate them, and deletes everything else before it becomes a bill nobody wants to explain.
  • Setting up S3 for production

    Setting up S3 for production

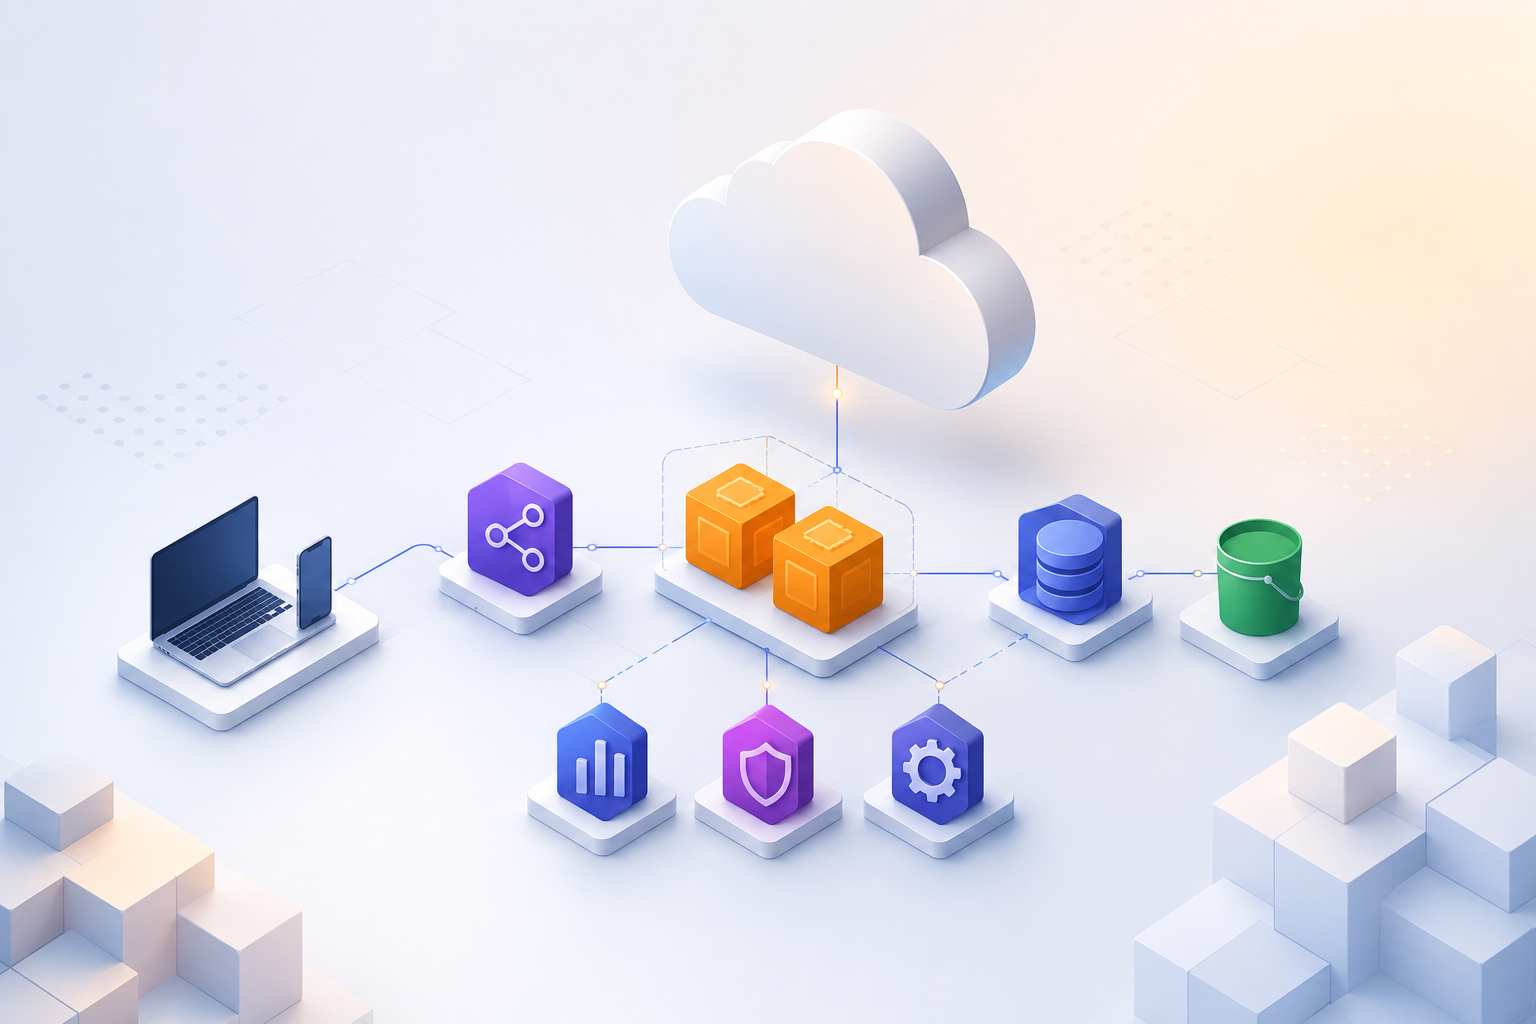
    S3 is the storage layer underneath almost every AWS workload. Static websites serve assets from it, Lambda functions write results to it, CloudFront pulls content through it, RDS snapshots land in it. It shows up in every architecture diagram as a box with an arrow pointing at it, and most teams never look past that box until something goes wrong — a bucket gets exposed publicly, costs spike unexpectedly, or a critical file gets overwritten and there is no way to get it back.

    Setting up S3 correctly for production takes about fifteen minutes and prevents a category of problems that would otherwise take hours to recover from.


    Block Public Access First

    When you create a new S3 bucket, public access is blocked by default. That is the correct state for almost every production bucket. The mistake happens when someone turns it off to troubleshoot something and never turns it back on, or when a bucket policy is written incorrectly and quietly makes objects publicly readable.

    The safest thing to do after creating any production bucket is to enforce block public access explicitly at the bucket level, so no policy or ACL change can accidentally expose it:

    aws s3api put-public-access-block \
      --bucket my-production-bucket \
      --public-access-block-configuration \
        BlockPublicAcls=true,\
        IgnorePublicAcls=true,\
        BlockPublicPolicy=true,\
        RestrictPublicBuckets=true

    If you are serving content publicly — a static website, downloadable assets — the correct pattern is to keep the bucket private and put CloudFront in front of it with Origin Access Control. CloudFront can serve the content publicly while the bucket itself never needs to be exposed. Turning on public access at the bucket level is almost never the right solution.

    If you attempt to apply a bucket policy that grants public read access while block public access is enabled, S3 will reject the policy with an error. This is the intended behavior — it is a guard, not a bug.


    Enable Versioning

    Versioning keeps every version of every object ever written to the bucket. When a file is overwritten, S3 stores the new version alongside the previous one rather than replacing it. When a file is deleted, S3 creates a delete marker rather than actually removing the data.

    aws s3api put-bucket-versioning \
      --bucket my-production-bucket \
      --versioning-configuration Status=Enabled

    The immediate benefit is accidental deletion recovery. If a deployment script writes the wrong file to the wrong key, or a bug in application code deletes an object it should not have deleted, versioning means you can restore the previous state without any backup infrastructure.

    The thing versioning does not do automatically is control how many versions accumulate. A bucket with versioning enabled and no lifecycle rules will keep every version of every object indefinitely. On a bucket with frequent writes this adds up quickly — you are paying for storage on objects no application is reading. The solution to this is lifecycle rules, covered next.

    One important behavior: once versioning is enabled on a bucket it can be suspended but not fully disabled. Suspending versioning stops creating new versions but does not delete existing ones. Plan accordingly before enabling it.


    Set Up Lifecycle Rules

    Lifecycle rules automate what happens to objects and their versions over time. They are one of the most effective cost controls in S3 and require no ongoing maintenance once configured.

    A typical production setup combines two rules: one that transitions current versions of infrequently accessed objects to a cheaper storage class, and one that expires old versions after a set number of days.

    aws s3api put-bucket-lifecycle-configuration \
      --bucket my-production-bucket \
      --lifecycle-configuration '{
        "Rules": [
          {
            "ID": "transition-old-versions",
            "Status": "Enabled",
            "Filter": {},
            "NoncurrentVersionTransitions": [
              {
                "NoncurrentDays": 30,
                "StorageClass": "STANDARD_IA"
              }
            ],
            "NoncurrentVersionExpiration": {
              "NoncurrentDays": 90
            }
          },
          {
            "ID": "expire-incomplete-multipart",
            "Status": "Enabled",
            "Filter": {},
            "AbortIncompleteMultipartUpload": {
              "DaysAfterInitiation": 7
            }
          }
        ]
      }'

    The first rule moves noncurrent versions to S3 Standard-IA after 30 days — a storage class that costs roughly 45% less than Standard but charges a retrieval fee, which is acceptable for old versions you are unlikely to need. After 90 days, old versions are deleted entirely. The second rule cleans up incomplete multipart uploads — files that were partially uploaded and abandoned. These are invisible in the console but count toward your storage bill.

    If your bucket stores logs or exports that are only needed for a fixed window, add a rule that expires current objects after that window. A logging bucket that expires objects after 90 days costs a fraction of one that retains them indefinitely.


    S3 Storage Classes and When to Use Them

    Storage class is the primary lever for cutting S3 costs. The default is S3 Standard, which is optimized for frequently accessed data. Most buckets do not need Standard for everything they contain.

    Storage Class Best For Relative Cost
    S3 Standard Frequently accessed data, active production objects Baseline
    S3 Standard-IA Accessed less than once a month, must retrieve quickly ~45% cheaper storage, retrieval fee applies
    S3 Glacier Instant Retrieval Archival data accessed once a quarter, millisecond retrieval ~68% cheaper storage
    S3 Glacier Flexible Retrieval Long-term archival, retrieval in minutes to hours is acceptable ~77% cheaper storage
    S3 Intelligent-Tiering Unknown or unpredictable access patterns Monitoring fee per object, automatic tiering

    S3 Intelligent-Tiering is worth calling out separately. It monitors access patterns per object and automatically moves objects between frequent and infrequent access tiers. There is a small per-object monitoring fee — $0.0025 per 1,000 objects per month — which makes it cost-effective only above a certain object size. For objects smaller than 128KB, the monitoring fee often exceeds the savings. For larger objects with unpredictable access, it is one of the easiest cost optimizations available.


    Enable Server-Side Encryption

    Since January 2023, AWS encrypts all new objects in S3 by default using SSE-S3 — server-side encryption with Amazon-managed keys. For most workloads this is sufficient. If your compliance requirements mandate customer-managed keys, switch to SSE-KMS:

    aws s3api put-bucket-encryption \
      --bucket my-production-bucket \
      --server-side-encryption-configuration '{
        "Rules": [{
          "ApplyServerSideEncryptionByDefault": {
            "SSEAlgorithm": "aws:kms",
            "KMSMasterKeyID": "arn:aws:kms:us-east-1:123456789012:key/your-key-id"
          },
          "BucketKeyEnabled": true
        }]
      }'

    The BucketKeyEnabled: true flag is important for cost control when using SSE-KMS. Without it, every object request makes a separate call to AWS KMS to retrieve the encryption key, and KMS charges per API call. A bucket key generates a short-lived key at the bucket level that encrypts individual objects locally, reducing KMS API calls by up to 99%.

    If you enable SSE-KMS without bucket keys on a high-throughput bucket, the KMS cost can exceed the S3 storage cost. This is a common surprise.


    Write a Bucket Policy

    A bucket policy controls who can perform which actions on the bucket and its objects. Without one, access is controlled entirely by IAM policies on the identities accessing the bucket. Adding a bucket policy lets you enforce constraints at the resource level — useful for restricting access to specific VPCs, requiring encryption on upload, or denying access from outside your organization.

    A minimal production bucket policy that denies unencrypted uploads and restricts access to a specific IAM role:

    {
      "Version": "2012-10-17",
      "Statement": [
        {
          "Sid": "DenyUnencryptedUploads",
          "Effect": "Deny",
          "Principal": "*",
          "Action": "s3:PutObject",
          "Resource": "arn:aws:s3:::my-production-bucket/*",
          "Condition": {
            "StringNotEquals": {
              "s3:x-amz-server-side-encryption": "aws:kms"
            }
          }
        },
        {
          "Sid": "AllowAppRole",
          "Effect": "Allow",
          "Principal": {
            "AWS": "arn:aws:iam::123456789012:role/app-role"
          },
          "Action": ["s3:GetObject", "s3:PutObject"],
          "Resource": "arn:aws:s3:::my-production-bucket/*"
        }
      ]
    }

    The deny statement on unencrypted uploads means any PutObject request that does not include the SSE-KMS header will be rejected, regardless of what the calling identity’s IAM policy allows. Explicit denies in bucket policies override IAM allows — the same evaluation rule that applies to all IAM policy evaluation.

    If you restrict a bucket to a specific IAM role and then try to access it from the AWS console with your own user credentials, the deny will apply to you too. This is the correct behavior but it catches people off guard the first time.


    Enable Access Logging

    S3 access logging writes a record of every request made to a bucket — who made it, what object they accessed, what the response was, and when it happened. This is essential for security auditing and for diagnosing unexpected access patterns or costs.

    aws s3api put-bucket-logging \
      --bucket my-production-bucket \
      --bucket-logging-status '{
        "LoggingEnabled": {
          "TargetBucket": "my-access-logs-bucket",
          "TargetPrefix": "production/"
        }
      }'

    Logs are delivered to a separate bucket — not the bucket being logged, since that would cause an infinite logging loop. The logs themselves are S3 objects and count toward your storage bill, so add a lifecycle rule on the logging bucket to expire logs after however many days your retention policy requires.


    Final Thoughts

    A production S3 bucket is not just a place to put files. The defaults get you running but they do not get you secure, resilient, or cost-efficient. The configuration covered here — blocking public access, enabling versioning, setting lifecycle rules, choosing the right storage class, enforcing encryption, writing a bucket policy, and enabling logging — adds up to maybe twenty minutes of setup that prevents a significant class of production incidents.

    • Block public access explicitly — do not rely on no policy being in place
    • Enable versioning but pair it with lifecycle rules or old versions will accumulate indefinitely
    • Lifecycle rules on noncurrent versions and incomplete multipart uploads are the fastest cost wins
    • Enable bucket keys when using SSE-KMS or KMS API costs will surprise you
    • Write access logs to a separate bucket with its own expiry rule

    The buckets that cause production incidents are almost never the ones that were carefully configured. They are the ones that were created quickly to solve an immediate problem and never revisited.

  • Configuring VPC Endpoints

    Configuring VPC Endpoints

    If you have ever put a Lambda function or an EC2 instance inside a private subnet and then tried to reach S3 or DynamoDB from it, you already know the problem. The request just hangs. There is no internet gateway, no NAT device, no route out — so the traffic has nowhere to go. The usual fix people reach for is a NAT Gateway, which works, but costs money every hour it exists and sends your AWS-to-AWS traffic out through the public internet before it comes back in. That is a strange thing to do when both sides of the connection are already inside AWS.

    VPC Endpoints solve this properly. They let resources in your VPC talk directly to supported AWS services over the AWS private network, without a NAT device, without a public IP, and without the traffic ever leaving Amazon’s infrastructure. There are two types — Gateway Endpoints and Interface Endpoints — and understanding when to use each one is the first thing to get right.


    Gateway Endpoints vs Interface Endpoints

    Gateway Endpoints are the simpler of the two. They work by adding a route to your VPC route table that points S3 or DynamoDB traffic at the endpoint instead of out through a gateway. That is the entire mechanism. They are also free, which makes them a straightforward choice — if you are accessing S3 or DynamoDB from a private subnet, there is almost no reason not to use one.

    Interface Endpoints are different. Instead of modifying a route table, they create an Elastic Network Interface directly inside your subnet, assigned a private IP address from your own CIDR range. That ENI becomes the entry point for traffic to the service. They are powered by AWS PrivateLink and support over 130 AWS services — SQS, SNS, ECR, CloudWatch, Secrets Manager, and many more. Unlike Gateway Endpoints, they do carry an hourly cost plus a data processing charge.

    Attribute Gateway Endpoint Interface Endpoint
    Services supported Amazon S3, Amazon DynamoDB only 130+ AWS services
    How it works Route table entry using a managed prefix list ENI with a private IP in your subnet
    Uses AWS PrivateLink No Yes
    Security group support Not supported Supported
    Cost Free Hourly charge + data processing

    Setting Up a Gateway Endpoint for S3

    Start by knowing your VPC ID and the route table ID for the private subnet you want to give S3 access to. If you are not sure which route table is associated with a subnet, this will tell you:

    aws ec2 describe-route-tables \
      --filters "Name=vpc-id,Values=vpc-1a2b3c4d" \
      --query "RouteTables[*].{RouteTableId:RouteTableId,SubnetId:Associations[*].SubnetId}" \
      --output table

    Once you have the route table ID, creating the endpoint is a single command:

    aws ec2 create-vpc-endpoint \
      --vpc-id vpc-1a2b3c4d \
      --service-name com.amazonaws.us-east-1.s3 \
      --route-table-ids rtb-11aa22bb

    AWS automatically inserts a new route into that route table. The destination will be the S3 managed prefix list — something like pl-63a5400a — and the target will be the endpoint ID. You do not manage this route manually. Deleting the endpoint removes the route automatically.

    A DynamoDB Gateway Endpoint works identically — just swap the service name:

    aws ec2 create-vpc-endpoint \
      --vpc-id vpc-1a2b3c4d \
      --service-name com.amazonaws.us-east-1.dynamodb \
      --route-table-ids rtb-11aa22bb

    One thing that catches people out: if you have multiple private subnets across different availability zones, each with its own route table, you need to associate the endpoint with each of those route tables. An endpoint associated with only one route table will not cover resources in the other subnets.


    Setting Up an Interface Endpoint

    For anything that is not S3 or DynamoDB, you need an Interface Endpoint. The example below creates one for SQS, but the pattern is the same regardless of the service — only the service name changes.

    aws ec2 create-vpc-endpoint \
      --vpc-id vpc-1a2b3c4d \
      --vpc-endpoint-type Interface \
      --service-name com.amazonaws.us-east-1.sqs \
      --subnet-ids subnet-abc123 subnet-def456 \
      --security-group-ids sg-11223344 \
      --private-dns-enabled

    The --private-dns-enabled flag is worth understanding. When you enable it, AWS creates a private hosted zone in Route 53 that overrides the public DNS name for the service. So when any resource in your VPC calls sqs.us-east-1.amazonaws.com, the name resolves to the private IP of your ENI rather than the public SQS endpoint. Your application code does not need to change at all — it keeps using the same endpoint URL it always did.

    If private DNS is not enabled, your application would need to explicitly use the endpoint-specific DNS name, which is less practical and easy to get wrong.


    A Real Example: Lambda in a Private Subnet

    This is the scenario where VPC Endpoints matter most in practice. You have a Lambda function running inside a private subnet — maybe because it needs access to an RDS database, or because your security requirements prohibit public internet access. The problem is that the moment you put Lambda inside a VPC with no internet route, it loses access to every AWS service it was previously calling: S3, DynamoDB, CloudWatch Logs, Secrets Manager, and so on.

    The instinct is to add a NAT Gateway so the function can reach those services through the internet. But that is unnecessary and expensive. The right answer is endpoints.

    For S3 and DynamoDB, create Gateway Endpoints — they are free and the setup is already covered above. For CloudWatch Logs, which Lambda needs to write execution logs, create an Interface Endpoint:

    aws ec2 create-vpc-endpoint \
      --vpc-id vpc-1a2b3c4d \
      --vpc-endpoint-type Interface \
      --service-name com.amazonaws.us-east-1.logs \
      --subnet-ids subnet-abc123 \
      --security-group-ids sg-11223344 \
      --private-dns-enabled

    The security group on an Interface Endpoint controls which resources can send traffic to it. At a minimum, allow inbound HTTPS (port 443) from the security group or CIDR range of the Lambda function. One failure mode that is easy to miss: if your Lambda function is not writing logs and you cannot figure out why, check whether a logs Interface Endpoint exists and whether its security group allows traffic from the Lambda function. CloudWatch log delivery failures do not surface as Lambda invocation errors, so the function will appear to succeed while silently dropping all log output.


    Locking Down Access with Endpoint Policies

    By default, a VPC Endpoint allows full access to the service. That is fine for getting started, but in a production environment you almost always want to restrict what can be done through the endpoint. Endpoint policies are IAM resource policies attached to the endpoint itself, and they act as an additional layer of control on top of whatever IAM permissions your resources already have.

    A common pattern is restricting an S3 endpoint to a specific bucket, so that even if something in your VPC has overly broad S3 permissions, the endpoint policy acts as a backstop:

    aws ec2 modify-vpc-endpoint \
      --vpc-endpoint-id vpce-1a2b3c4d \
      --policy-document '{
        "Version": "2012-10-17",
        "Statement": [{
          "Effect": "Allow",
          "Principal": "*",
          "Action": ["s3:GetObject", "s3:PutObject"],
          "Resource": "arn:aws:s3:::my-production-bucket/*"
        }]
      }'

    Be careful here if multiple applications share the same VPC and the same endpoint. A policy scoped to one bucket will block all other S3 traffic through that endpoint, including calls from other workloads to other buckets. If you need different policies for different workloads, the options are separate endpoints or separate VPCs.


    Checking and Cleaning Up Endpoints

    To see all endpoints in a VPC and their current state:

    aws ec2 describe-vpc-endpoints \
      --filters "Name=vpc-id,Values=vpc-1a2b3c4d" \
      --query "VpcEndpoints[*].{Id:VpcEndpointId,Service:ServiceName,State:State,Type:VpcEndpointType}" \
      --output table

    An endpoint state of available means it is active and routing traffic. A state of pending means it was just created and DNS or ENI provisioning is still in progress — this usually resolves within a couple of minutes. To delete an endpoint:

    aws ec2 delete-vpc-endpoints \
      --vpc-endpoint-ids vpce-1a2b3c4d

    An empty Unsuccessful array in the response confirms the deletion succeeded. Deleting a Gateway Endpoint removes its route from every associated route table automatically. Deleting an Interface Endpoint removes the ENIs from your subnets.


    VPC Endpoints are not a complex feature, but they are one that a lot of teams add too late — after they have already been paying for NAT Gateways they did not need, or after a security review flags their AWS service traffic going through the public internet. Getting them in place early, especially Gateway Endpoints for S3 and DynamoDB, is one of the higher-value things you can do when setting up a new VPC.

  • Deploying application load balancer

    Deploying application load balancer

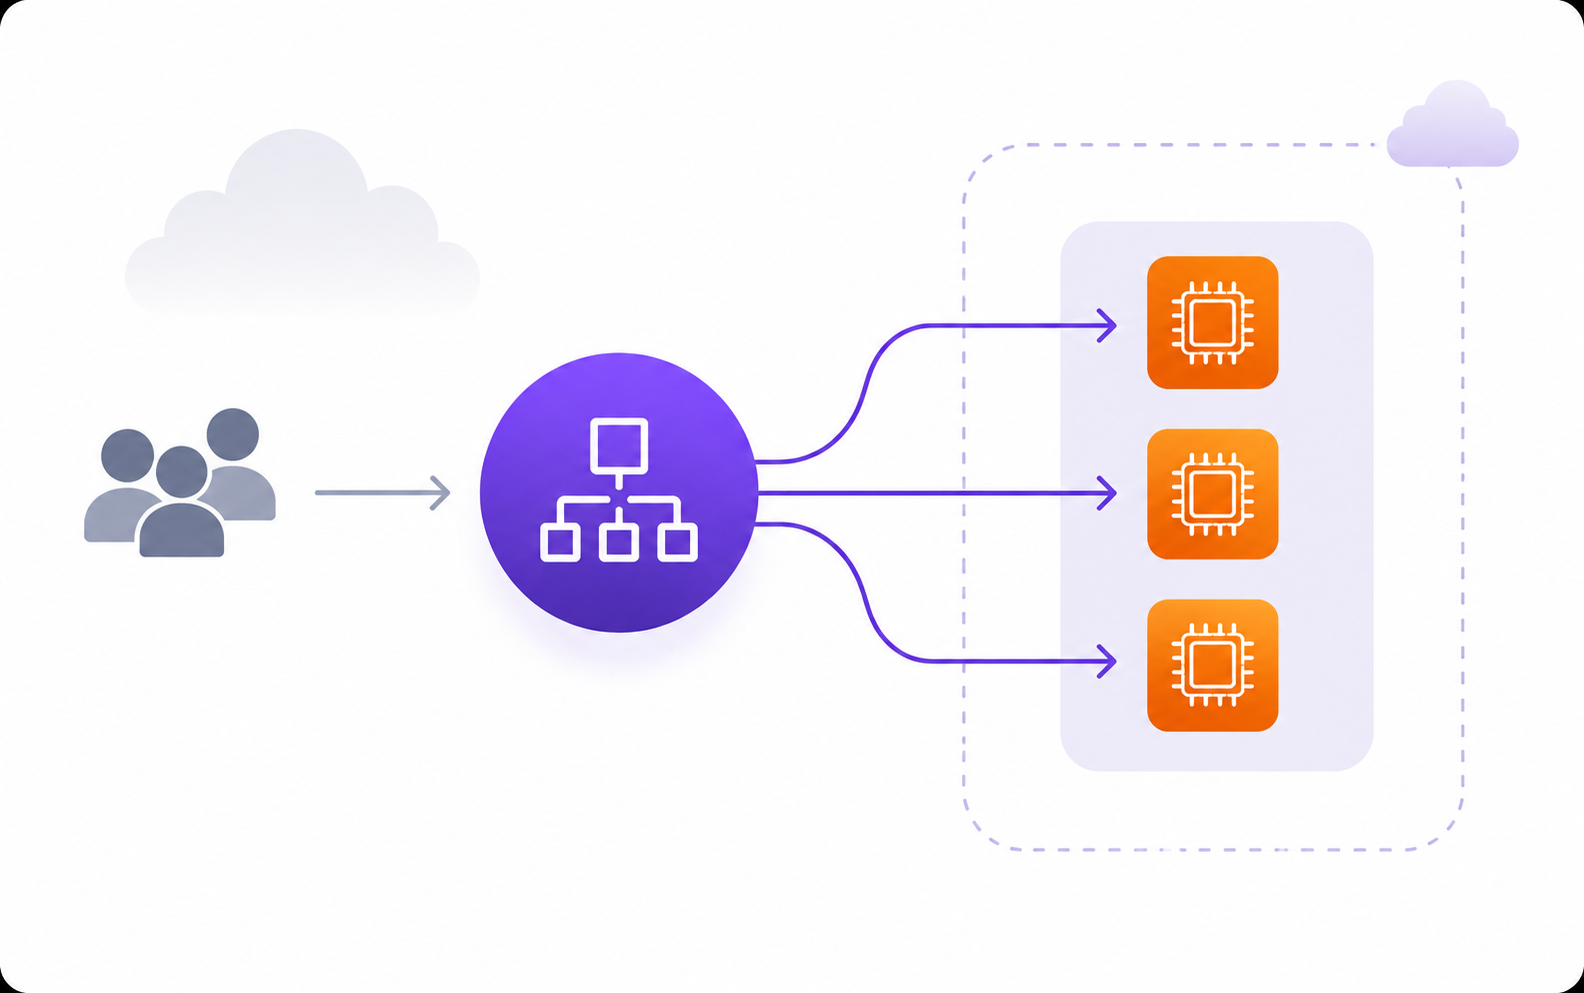
    An Application Load Balancer operates at Layer 7 — the HTTP layer. Unlike a classic load balancer which distributes traffic purely based on connection-level information, an ALB understands HTTP. It can read the request path, inspect headers, evaluate query strings, and make routing decisions based on what is actually in the request. That is what makes it the right choice for almost every web application workload on AWS.

    At its core, an ALB has three components: the load balancer itself, which accepts incoming traffic; listeners, which define which port and protocol to accept on; and target groups, which are the collection of instances or services that traffic gets forwarded to. A listener rule connects the two — it looks at an incoming request and decides which target group should receive it.


    What We Are Building

    A company runs a Node.js web application with two separate services behind a single domain. The main application handles customer-facing requests on port 3000. A separate admin service handles internal dashboard traffic on port 8080. Both run on EC2 instances spread across two availability zones in private subnets. The ALB sits in public subnets and routes traffic based on path — requests to /admin go to the admin service, everything else goes to the main application.

    This is a common and practical architecture. The EC2 instances never need public IP addresses. The ALB is the only thing exposed to the internet, and it controls what reaches the backend entirely through listener rules.


    Security Groups First

    Before creating anything else, the security groups need to be in the right shape. Two security groups are needed: one for the ALB and one for the EC2 instances. They work together — the EC2 security group allows inbound traffic only from the ALB’s security group, not from the internet directly.

    # Security group for the ALB — accepts HTTP and HTTPS from the internet aws ec2 create-security-group \ --group-name alb-sg \ --description "Security group for application load balancer" \ --vpc-id vpc-1a2b3c4d aws ec2 authorize-security-group-ingress \ --group-id sg-alb123 \ --protocol tcp --port 80 --cidr 0.0.0.0/0 aws ec2 authorize-security-group-ingress \ --group-id sg-alb123 \ --protocol tcp --port 443 --cidr 0.0.0.0/0
    # Security group for EC2 instances — accepts traffic only from the ALB aws ec2 create-security-group \ --group-name app-sg \ --description "Security group for application instances" \ --vpc-id vpc-1a2b3c4d # Allow port 3000 from ALB security group only aws ec2 authorize-security-group-ingress \ --group-id sg-app456 \ --protocol tcp --port 3000 \ --source-group sg-alb123 # Allow port 8080 from ALB security group only aws ec2 authorize-security-group-ingress \ --group-id sg-app456 \ --protocol tcp --port 8080 \ --source-group sg-alb123

    Using the ALB’s security group as the source rather than a CIDR range means that even if the CIDR range of your VPC changes or expands, this rule does not need to be updated. More importantly, it guarantees that traffic can only reach the instances if it came through the ALB. If someone finds the instance’s private IP and tries to reach it directly from within the VPC, the security group blocks them too.


    Creating the Load Balancer

    The ALB needs to be placed in at least two public subnets in different availability zones. This is a hard requirement — creating an ALB with subnets in the same availability zone will fail. The two-subnet minimum is also what gives the ALB its availability guarantee: if one zone has an outage, the ALB keeps routing through the other zone automatically.

    aws elbv2 create-load-balancer \ --name app-alb \ --type application \ --scheme internet-facing \ --subnets subnet-pub-1a subnet-pub-1b \ --security-groups sg-alb123

    Note the ARN in the response — it is needed for every subsequent step. The ALB also gets a DNS name like app-alb-123456789.us-east-1.elb.amazonaws.com which is what your DNS record should point to. ALBs never have static IP addresses, so you always use the DNS name, never an IP.

    If you try to create the ALB with both subnets in the same availability zone, the CLI returns an error immediately. The same error appears if the subnets are not in the same VPC as the security group. Both of these are checked at creation time rather than at runtime, which makes them easier to catch.


    Creating Target Groups

    Two target groups are needed — one for the main application, one for the admin service. Each target group is independently configured with its own health check, port, and protocol.

    # Target group for the main application — port 3000 aws elbv2 create-target-group \ --name app-targets \ --protocol HTTP \ --port 3000 \ --vpc-id vpc-1a2b3c4d \ --target-type instance \ --health-check-path /health \ --health-check-interval-seconds 30 \ --healthy-threshold-count 2 \ --unhealthy-threshold-count 3
    # Target group for the admin service — port 8080 aws elbv2 create-target-group \ --name admin-targets \ --protocol HTTP \ --port 8080 \ --vpc-id vpc-1a2b3c4d \ --target-type instance \ --health-check-path /health \ --health-check-interval-seconds 30 \ --healthy-threshold-count 2 \ --unhealthy-threshold-count 3

    The --health-check-path is what the ALB requests from your instances to decide whether they are healthy. This path must return an HTTP 200. The default success code is 200, but you can configure a range anywhere between 200 and 499 if your application returns a different status code on its health endpoint.

    A mistake that happens frequently: the health check path is set to /health but the application has not actually implemented that route. The instances register with the target group, the ALB starts sending health checks to /health, the application returns a 404, and the ALB marks every target as unhealthy. No traffic gets routed anywhere. The load balancer appears to be working — it is provisioned, it has targets registered — but every request returns a 502 because there are no healthy targets to forward to. Always confirm the health check path exists and returns a 200 before registering instances.


    Registering Targets

    With the target groups created, register the EC2 instances into each one. Instances can be registered by instance ID or by IP address. Using instance ID is simpler for EC2-backed workloads.

    aws elbv2 register-targets \ --target-group-arn arn:aws:elasticloadbalancing:us-east-1:123456789012:targetgroup/app-targets/abc123 \ --targets Id=i-0123abc456def,Port=3000 Id=i-0456def789ghi,Port=3000 aws elbv2 register-targets \ --target-group-arn arn:aws:elasticloadbalancing:us-east-1:123456789012:targetgroup/admin-targets/def456 \ --targets Id=i-0123abc456def,Port=8080 Id=i-0456def789ghi,Port=8080

    After registration, the targets enter an initial state while the ALB runs the first round of health checks. They will not receive traffic until they pass the number of consecutive health checks defined by --healthy-threshold-count. With a threshold of 2 and an interval of 30 seconds, a newly registered instance takes at least 60 seconds before it starts receiving traffic. Factor this into deployment timings — if your deployment automation registers targets and then immediately checks whether the application is live, it will almost certainly see no traffic for the first minute.


    Creating Listeners and Routing Rules

    A listener on port 80 should redirect all traffic to HTTPS rather than serving HTTP directly. A listener on port 443 handles the actual routing.

    # Port 80 listener — redirect everything to HTTPS aws elbv2 create-listener \ --load-balancer-arn arn:aws:elasticloadbalancing:us-east-1:123456789012:loadbalancer/app/app-alb/abc123 \ --protocol HTTP \ --port 80 \ --default-actions '[{ "Type": "redirect", "RedirectConfig": { "Protocol": "HTTPS", "Port": "443", "StatusCode": "HTTP_301" } }]'
    # Port 443 listener — routes to app target group by default aws elbv2 create-listener \ --load-balancer-arn arn:aws:elasticloadbalancing:us-east-1:123456789012:loadbalancer/app/app-alb/abc123 \ --protocol HTTPS \ --port 443 \ --certificates CertificateArn=arn:aws:acm:us-east-1:123456789012:certificate/abc123 \ --default-actions '[{ "Type": "forward", "TargetGroupArn": "arn:aws:elasticloadbalancing:us-east-1:123456789012:targetgroup/app-targets/abc123" }]'

    Now add a path-based rule that routes /admin* to the admin target group. Listener rules are evaluated in priority order — lower numbers are evaluated first. The default action defined above acts as a catch-all and fires only when no rule matches.

    aws elbv2 create-rule \ --listener-arn arn:aws:elasticloadbalancing:us-east-1:123456789012:listener/app/app-alb/abc123/listener456 \ --priority 10 \ --conditions '[{ "Field": "path-pattern", "Values": ["/admin*"] }]' \ --actions '[{ "Type": "forward", "TargetGroupArn": "arn:aws:elasticloadbalancing:us-east-1:123456789012:targetgroup/admin-targets/def456" }]'

    If two rules share the same priority number, the CLI returns an error and neither rule is created. Priority values do not need to be sequential — leaving gaps between them (10, 20, 30 rather than 1, 2, 3) makes it easier to insert new rules later without reordering everything.


    Verifying the Setup

    Check the health of registered targets before sending any real traffic:

    aws elbv2 describe-target-health \ --target-group-arn arn:aws:elasticloadbalancing:us-east-1:123456789012:targetgroup/app-targets/abc123

    The output shows a State field for each target: healthy, unhealthy, initial, or unused. If any target is unhealthy, the output also includes a Reason field that tells you whether the failure originated on the load balancer side (Elb.* reason codes) or the target side (Target.* reason codes). A Target.ResponseCodeMismatch means the health check endpoint is reachable but returning the wrong status code. A Target.ConnectionError means the ALB cannot reach the instance at all — usually a security group misconfiguration.


    Final Thoughts

    The most common failure patterns with an ALB are all variations of the same two problems: security group rules that do not allow the right traffic through, and health check paths that do not exist or return unexpected status codes. Both produce the same symptom — a 502 from the load balancer — and both are straightforward to diagnose once you know to look at target health first rather than the application logs.

    • ALB requires at least two subnets in different availability zones — same-AZ subnets fail at creation
    • EC2 security groups must allow inbound traffic from the ALB security group, not from a CIDR
    • Health check paths must exist and return a 200 before any target receives traffic
    • Newly registered targets take at least one full health check cycle before going live
    • Listener rules with duplicate priority numbers fail — leave gaps between priority values

    An ALB that is routing correctly is invisible — traffic flows, instances receive requests, users never think about it. The work is in the setup: getting security groups right, health checks right, and listener rules right before the first request arrives.

  • Deploying a cloudfront distribution

    Deploying a cloudfront distribution

    Serving files directly from S3 works, but it has two problems that surface quickly in production. The first is latency — an S3 bucket lives in one region, and a user in Singapore hitting a bucket in us-east-1 feels that distance on every request. The second is cost — S3 data transfer rates are higher than CloudFront’s, and every request hits the bucket directly with no caching in between.

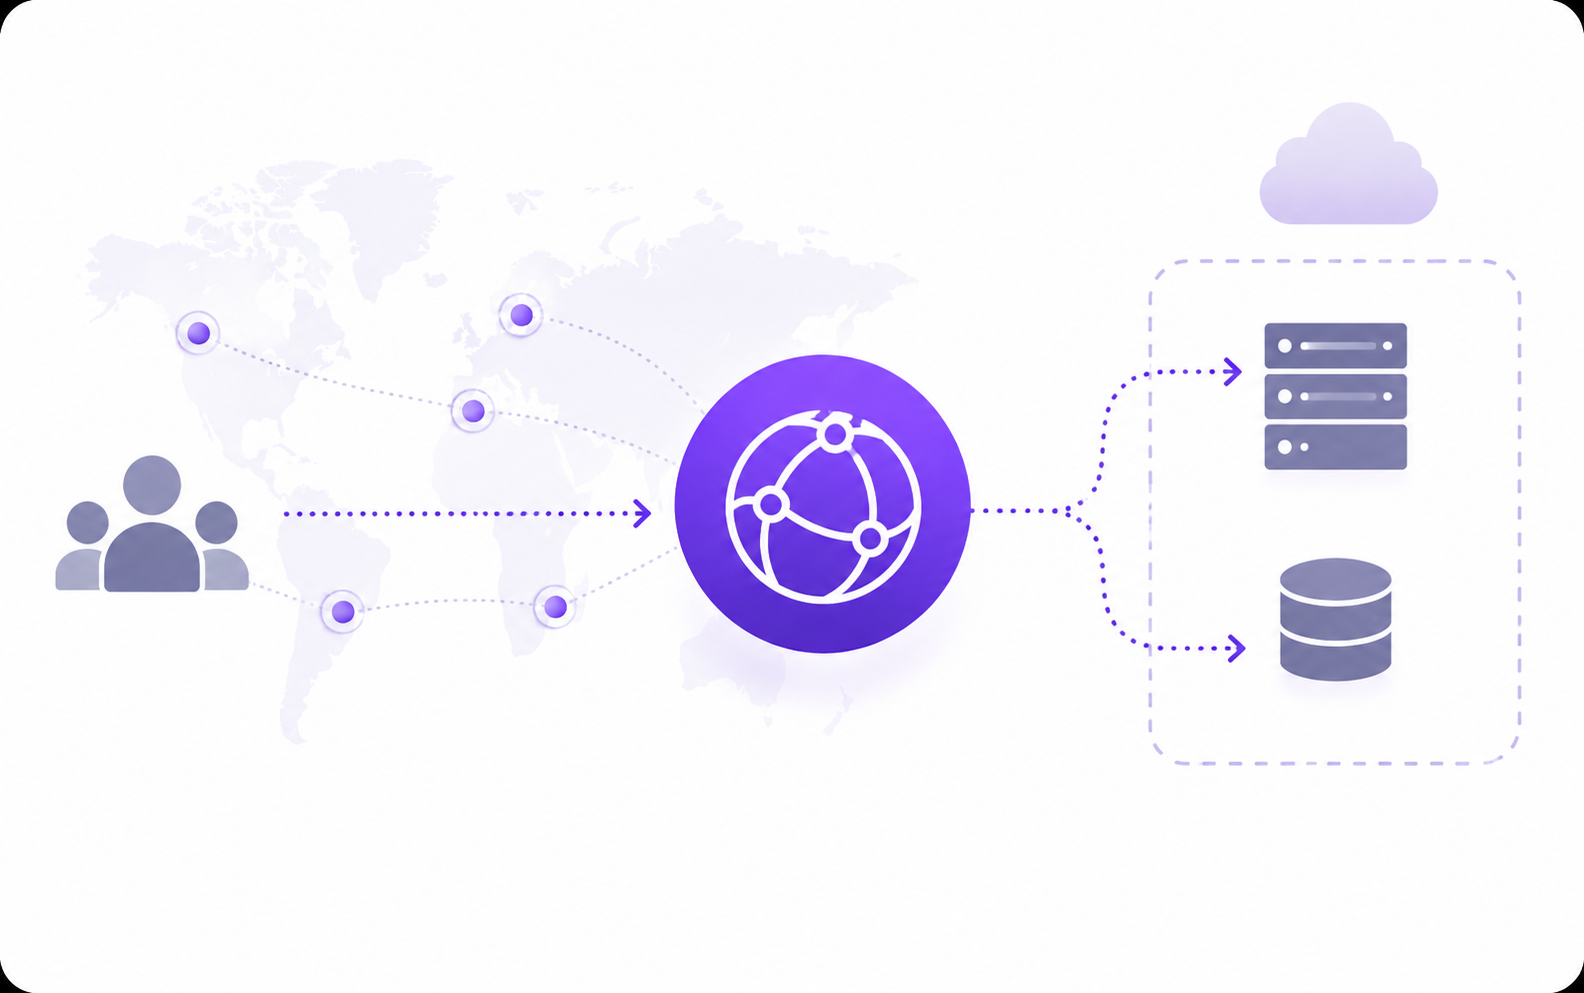
    CloudFront solves both. It is a content delivery network with over 750 edge locations across more than 440 cities worldwide. When a user requests a file, the request goes to the nearest edge location. If the file is cached there, it is served immediately without touching the origin at all. If not, CloudFront fetches it from the origin, caches it at the edge, and serves all subsequent requests from cache until the TTL expires. The origin — whether that is S3, an Application Load Balancer, or an EC2 instance — only gets hit for the first request per edge location.


    How a Distribution Works

    When you create a CloudFront distribution, you configure two main things: an origin and a cache behavior. The origin is where CloudFront fetches content when it is not cached. The cache behavior defines how CloudFront handles requests — which HTTP methods to allow, how long to cache responses, and whether to forward headers, cookies, or query strings to the origin.

    Every distribution gets a domain name that looks like d1234abcd.cloudfront.net. That is what users hit until you configure a custom domain. Requests flow like this:

    • User requests a file from the CloudFront domain
    • The request routes to the nearest edge location
    • If the file is in the edge cache and the TTL has not expired — cache hit, served immediately
    • If not — CloudFront fetches from the origin, caches it, serves the response
    • All subsequent requests from any user at that edge location are served from cache

    The default TTL is 24 hours if your origin does not send a Cache-Control header. If your origin does send one, CloudFront honors it. That distinction matters more than most people realize when it comes to deploying updates.


    Creating a Distribution with an S3 Origin

    Imagine you have just built a React single-page application. The production build produces a dist/ folder of static HTML, JavaScript, and CSS files. You have uploaded those to an S3 bucket and now want to serve them globally through CloudFront.

    The first thing to decide is Origin Access Control. CloudFront supports a mechanism called OAC — Origin Access Control — that lets you keep the S3 bucket completely private while still allowing CloudFront to read from it. This is the current AWS recommendation and replaces the older Origin Access Identity approach. Without OAC, you have two bad options: make the bucket public, or try to restrict access in other ways that are harder to maintain.

    Start by creating the OAC:

    aws cloudfront create-origin-access-control \ --origin-access-control-config \ Name=my-app-oac,\ OriginAccessControlOriginType=s3,\ SigningBehavior=always,\ SigningProtocol=sigv4

    Note the Id value in the response — you need it when creating the distribution. Now create the distribution, pointing it at the S3 bucket and attaching the OAC:

    aws cloudfront create-distribution \ --distribution-config '{ "CallerReference": "my-app-dist-001", "Origins": { "Quantity": 1, "Items": [{ "Id": "my-app-s3-origin", "DomainName": "my-app-bucket.s3.us-east-1.amazonaws.com", "S3OriginConfig": { "OriginAccessIdentity": "" }, "OriginAccessControlId": "YOUR_OAC_ID" }] }, "DefaultCacheBehavior": { "TargetOriginId": "my-app-s3-origin", "ViewerProtocolPolicy": "redirect-to-https", "CachePolicyId": "658327ea-f89d-4fab-a63d-7e88639e58f6", "AllowedMethods": { "Quantity": 2, "Items": ["GET", "HEAD"] } }, "DefaultRootObject": "index.html", "Enabled": true, "Comment": "My React App" }'

    The CachePolicyId above is the ID for CloudFront’s managed CachingOptimized policy, which is the right default for static assets. ViewerProtocolPolicy set to redirect-to-https means HTTP requests are automatically redirected to HTTPS — users get a secure connection without any changes to your application code.

    If you forget to set DefaultRootObject to index.html, visiting the root URL of your distribution returns a 403 error. CloudFront does not know which file to serve when someone navigates to https://d1234abcd.cloudfront.net/ without a path. This is one of the most common CloudFront gotchas and one of the easier ones to miss when creating the distribution.


    Locking Down the S3 Bucket

    Creating the distribution with OAC is only half the step. The S3 bucket policy still needs to explicitly allow CloudFront to read from it. Until you add this policy, every request from CloudFront to S3 returns a 403 and your distribution serves nothing.

    aws s3api put-bucket-policy \ --bucket my-app-bucket \ --policy '{ "Version": "2012-10-17", "Statement": [{ "Effect": "Allow", "Principal": { "Service": "cloudfront.amazonaws.com" }, "Action": "s3:GetObject", "Resource": "arn:aws:s3:::my-app-bucket/*", "Condition": { "StringEquals": { "AWS:SourceArn": "arn:aws:cloudfront::123456789012:distribution/YOUR_DISTRIBUTION_ID" } } }] }'

    The AWS:SourceArn condition is what makes OAC meaningfully more secure than a general bucket policy. It restricts read access not just to the CloudFront service but to your specific distribution. Without that condition, any CloudFront distribution in any AWS account could potentially read from your bucket by pointing at it as an origin. With it, only your distribution can.


    Caching and TTL

    By default, CloudFront caches objects for 24 hours. For a static React app where the HTML, JavaScript, and CSS files change with every deployment, 24 hours means users could be served a stale version of your application for up to a day after you release an update.

    The right approach depends on the type of file. Your index.html — the entry point — should have a short or zero TTL because it is the file that references your other assets. Your JavaScript and CSS bundles should have a very long TTL — a year is common — because they are immutable. You change the filename (using a content hash like app.a1b2c3d4.js) rather than the content, so an old URL will never receive new content.

    Set the cache behavior on the origin by adding Cache-Control headers to your S3 objects when you upload them:

    # Short TTL for the entry point aws s3 cp dist/index.html s3://my-app-bucket/ \ --cache-control "no-cache, no-store, must-revalidate" # Long TTL for hashed static assets aws s3 cp dist/ s3://my-app-bucket/ \ --recursive \ --exclude "index.html" \ --cache-control "public, max-age=31536000, immutable"

    CloudFront honors these headers. The edge caches index.html briefly and the hashed assets for up to a year. When you deploy a new version of the app, the new index.html references different hashed filenames, so users automatically get the new assets without any manual cache clearing.


    Invalidating the Cache

    Sometimes you need to force CloudFront to stop serving a cached file before its TTL expires — a critical bug fix, a wrong file uploaded, a configuration change that needs to take effect immediately. That is what invalidations are for.

    aws cloudfront create-invalidation \ --distribution-id YOUR_DISTRIBUTION_ID \ --paths "/index.html"

    For clearing everything at once, a wildcard path counts as a single invalidation path regardless of how many files it matches:

    aws cloudfront create-invalidation \ --distribution-id YOUR_DISTRIBUTION_ID \ --paths "/*"

    The first 1,000 invalidation paths per month are free. Beyond that, each path costs $0.005. A wildcard like /* counts as one path, so a single full-cache invalidation is always within the free tier if you are not running them constantly.

    Where teams get into trouble is running full invalidations on every deployment as part of a CI/CD pipeline. If you are deploying ten times a day, that is 300 invalidations a month — still within the free tier. But it means every user gets a cache miss on their next request after each deploy, which increases latency and drives up origin traffic. The file versioning approach with hashed filenames is the right long-term pattern because you never need to invalidate assets that have not changed.


    Custom Domains and HTTPS

    The default CloudFront domain works, but in production you almost always want your own domain — app.yourdomain.com instead of d1234abcd.cloudfront.net. This requires two things: an ACM certificate for your domain, and a CNAME record pointing your domain at the CloudFront distribution.

    The certificate must be requested in us-east-1, regardless of where your infrastructure lives. CloudFront is a global service and only reads ACM certificates from the North Virginia region. This catches people every time — if you request the certificate in eu-west-1 where the rest of your stack lives, the certificate simply does not appear as an option when configuring the distribution.

    # Must be run against us-east-1 regardless of your stack region aws acm request-certificate \ --domain-name app.yourdomain.com \ --validation-method DNS \ --region us-east-1

    After DNS validation completes, update your distribution with the custom domain and certificate, then add a CNAME record in your DNS provider pointing app.yourdomain.com at your CloudFront distribution domain name.


    Price Classes

    By default, CloudFront routes requests through all of its edge locations globally. That gives you the best possible latency for every user but also means you are paying for data transfer in every region — including South America and India, where rates are roughly double the US and Europe rate.

    If your users are concentrated in North America and Europe, switching to Price Class 100 removes the more expensive regions from your distribution and reduces your data transfer bill with minimal latency impact for your actual user base:

    Price Class Regions Included Use When
    Price Class All All edge locations globally Global user base or latency is the primary concern
    Price Class 200 All regions except South America and Oceania Broad global reach with moderate cost reduction
    Price Class 100 US, Canada, Mexico, Europe, Israel only User base is primarily North America and Europe

    The decision is straightforward: look at where your users actually are before committing to Price Class All. Paying for edge locations in regions that generate no traffic is one of the more common CloudFront cost problems and one of the easier ones to avoid.


    Final Thoughts

    A CloudFront distribution in front of S3 is not much more complicated than an S3 bucket alone, but the details that matter most are easy to overlook the first time: setting the default root object, updating the bucket policy after enabling OAC, requesting the ACM certificate in us-east-1, and thinking through TTL before you deploy rather than after users start seeing stale content.

    • OAC keeps the S3 bucket private — the bucket policy must be updated after creating the distribution
    • Missing DefaultRootObject causes a 403 on the root URL
    • ACM certificates for CloudFront must be in us-east-1
    • File versioning with hashed filenames is better than relying on invalidations
    • Price Class 100 reduces cost significantly if your users are in North America and Europe

    The biggest CloudFront mistakes are not technical — they are operational. Long TTLs on files that change, invalidations on every deploy, and Price Class All on a product with a regional user base. Getting the caching strategy right before launch is significantly less painful than fixing it after users start complaining about stale content.

  • Configuring IAM roles and policies

    Configuring IAM roles and policies

    Every AWS API call is an authenticated and authorized request. When a Lambda function reads from DynamoDB, when an EC2 instance uploads a file to S3, when a CloudFormation stack creates a VPC — all of it goes through IAM authorization evaluation first. If the identity making the request does not have permission, the call fails. If the identity has more permission than it needs, a bug or a compromised workload can do far more damage than it should.

    At its core, IAM authorization is built around identities and policies. An identity is the thing that acts — a role, a user, or a service. A policy is a document that defines what that identity is allowed or denied to do. Getting these right from the start is significantly easier than tightening them after something has gone wrong in production.


    Roles and Policies Are Two Different Things

    A role is an identity that AWS services and workloads can assume to take action on your behalf. A policy is a set of rules attached to that identity. They are separate objects in IAM and are connected by attaching one to the other. The distinction matters because a role without the right policies is useless, and policies without a role have nothing to enforce them.

    An IAM role always has two types of policy associated with it:

    • A trust policy — controls which principal is allowed to assume the role
    • A permission policy — controls what the role can do once it is assumed

    Both must be correct. A role with the right permission policy but a wrong trust policy can never be assumed — the permissions are irrelevant because nothing can use them. A role with the right trust policy but missing permissions can be assumed and then immediately fail when it tries to do anything. These two failures look different at runtime, which is useful to know before you run into them.


    The Trust Policy

    Imagine you are deploying a Lambda function that processes order data — it receives an event, reads the current order state from DynamoDB, and publishes a status update to an SNS topic. For the function to call DynamoDB or SNS at runtime, Lambda needs to assume an IAM role on behalf of the function and receive temporary credentials it can use to make those calls.

    The trust policy is what allows that to happen. It answers one question: which principal is permitted to assume this role? For a Lambda function, the answer is the Lambda service itself:

    {
      "Version": "2012-10-17",
      "Statement": [
        {
          "Effect": "Allow",
          "Principal": {
            "Service": "lambda.amazonaws.com"
          },
          "Action": "sts:AssumeRole"
        }
      ]
    }

    When you attach this role to the function, Lambda obtains temporary credentials for the role and makes them available to the runtime environment. Your code never handles credentials directly — the AWS SDK resolves them automatically from the runtime.

    A common mistake is creating the role for Lambda but setting the principal to ec2.amazonaws.com by copy-pasting from another example. The role creates without error. The policy attaches without error. The function deploys. The failure only surfaces at invocation time, when Lambda cannot assume the role. At that point CloudWatch Logs will usually show a message along the lines of “the role defined for the function cannot be assumed by Lambda” — but because the deployment succeeded, teams often look at the application code first rather than the trust policy, which is where the actual problem is.

    The correct principal for each common service:

    Service Principal
    Lambda lambda.amazonaws.com
    EC2 ec2.amazonaws.com
    ECS Tasks ecs-tasks.amazonaws.com
    CloudFormation cloudformation.amazonaws.com
    Glue glue.amazonaws.com

    Creating the Role

    Continuing with the order processing Lambda — save the trust policy to a file and create the role:

    aws iam create-role \
      --role-name order-processor-role \
      --assume-role-policy-document file://trust-policy.json

    The role now exists with a trust policy that allows Lambda to assume it. It has no permission policies yet, which means it can be assumed by Lambda and then do nothing. If you attached this to the function right now and invoked it, execution would start — the trust policy check passes — but the first DynamoDB call would return an AccessDeniedException. The function then fails partway through its execution path rather than failing at startup, which looks like an application error rather than a configuration error and takes longer to diagnose.


    Writing a Permission Policy

    The order processor needs three things: read access to a DynamoDB table that holds order state, publish access to an SNS topic for status updates, and write access to CloudWatch Logs so execution output is visible. The permission policy for that looks like this:

    {
      "Version": "2012-10-17",
      "Statement": [
        {
          "Effect": "Allow",
          "Action": [
            "dynamodb:GetItem",
            "dynamodb:Query"
          ],
          "Resource": "arn:aws:dynamodb:us-east-1:123456789012:table/orders"
        },
        {
          "Effect": "Allow",
          "Action": "sns:Publish",
          "Resource": "arn:aws:sns:us-east-1:123456789012:order-status-topic"
        },
        {
          "Effect": "Allow",
          "Action": [
            "logs:CreateLogGroup",
            "logs:CreateLogStream",
            "logs:PutLogEvents"
          ],
          "Resource": "arn:aws:logs:*:*:*"
        }
      ]
    }

    The Resource field on each statement is where least privilege actually happens. Specifying the exact ARN of the orders table instead of arn:aws:dynamodb:*:*:* means this function cannot read any other DynamoDB table in the account. If a bug in the function code tries to query the wrong table, or if someone exploits a vulnerability and attempts to read from a different table, IAM stops the request before it reaches DynamoDB.

    The CloudWatch Logs block is the one people most often forget. Without those three permissions, the function executes — it starts, runs, and returns a result — but application logs may fail to appear in CloudWatch Logs, making debugging significantly harder. There is no obvious error in the Lambda console pointing to missing log permissions. You typically only notice when you go to investigate something else and find no log output to work with.

    Create and Attach the Policy

    aws iam create-policy \
      --policy-name order-processor-policy \
      --policy-document file://permission-policy.json
    
    aws iam attach-role-policy \
      --role-name order-processor-role \
      --policy-arn arn:aws:iam::123456789012:policy/order-processor-policy

    How IAM Evaluates Permissions

    AWS does not evaluate a single policy in isolation — it evaluates all policies that apply to the identity making the request and combines them. The rule is that permissions are additive: if you have two policies attached to a role, one that allows s3:GetObject and one that allows s3:PutObject, the role can do both. You do not need everything in a single policy document.

    The exception — and it matters — is an explicit deny. An explicit Deny statement anywhere in the evaluation chain overrides every Allow, regardless of which policy it comes from or how many policies grant the action. If a Service Control Policy from your AWS Organization explicitly denies s3:DeleteObject, no permission policy on any role in that account can override it. The deny wins unconditionally.

    This is also the difference between implicitDeny and explicitDeny that the policy simulator reports. An implicitDeny just means nothing granted the permission — the default in IAM is always deny. An explicitDeny means something actively blocked it, and adding more permissions to the role will not fix the problem because the block is upstream of the role entirely.

    Beyond identity-based policies, several AWS services also support resource-based policies — policies attached to the resource rather than to the identity. S3 bucket policies, SNS topic policies, and SQS queue policies are common examples. A resource-based policy can grant access to a principal from a different AWS account, which identity-based policies alone cannot do. Both types of policy are evaluated together, and an explicit deny in either one overrides any allow in the other.


    Managed Policies vs Inline Policies

    Say you are now deploying a second Lambda function — a reporting job that reads completed orders and writes a daily summary to S3. It needs the same CloudWatch Logs permissions as the order processor, but different application permissions.

    Rather than writing the same CloudWatch Logs block into a second policy, attach the AWS-managed policy AWSLambdaBasicExecutionRole, which covers exactly those log permissions and is maintained by AWS:

    # Attach the managed policy for logs — reused across both functions
    aws iam attach-role-policy \
      --role-name order-reporter-role \
      --policy-arn arn:aws:iam::aws:policy/service-role/AWSLambdaBasicExecutionRole
    
    # Attach an inline policy for the reporting function's specific permissions
    aws iam put-role-policy \
      --role-name order-reporter-role \
      --policy-name reporter-s3-access \
      --policy-document file://reporter-policy.json

    A managed policy can be attached to any number of roles, which makes it easy to maintain common permissions in one place. The downside is blast radius — if you update a managed policy and the change is wrong, every role it is attached to is affected simultaneously. An inline policy is embedded in a single role and scoped entirely to it. If you make a mistake updating it, only that one role is affected. For permissions that are sensitive or environment-specific, inline policies give you a smaller blast radius when something changes incorrectly.


    What Happens When CloudFormation Creates IAM Resources

    Suppose you are deploying the order processing system through a CloudFormation template that creates the Lambda function, its execution role, and the permission policies all in one stack. When you run the deployment, CloudFormation will refuse to proceed without an additional flag:

    aws cloudformation deploy \
      --stack-name order-processing-stack \
      --template-file template.yaml \
      --capabilities CAPABILITY_IAM

    Without CAPABILITY_IAM, the deployment fails before a single resource is created. AWS requires explicit acknowledgment that your template will create or modify IAM resources. This is intentional friction — a guard against accidentally deploying a template that grants broader permissions than you intended.

    If your template creates named IAM resources — a role with an explicit name like order-processor-role rather than an auto-generated one — you need CAPABILITY_NAMED_IAM instead. Passing CAPABILITY_IAM for a template with named resources produces a different error pointing to the named variant. The two errors look similar, and confusing the two flags is a common stumble when deploying stacks that manage their own IAM roles.


    Testing a Policy Before It Causes Problems

    Before attaching the order processor policy to anything, you can verify exactly what it allows using the IAM policy simulator:

    aws iam simulate-principal-policy \
      --policy-source-arn arn:aws:iam::123456789012:role/order-processor-role \
      --action-names dynamodb:GetItem \
      --resource-arns arn:aws:dynamodb:us-east-1:123456789012:table/orders

    Running the same check against a table the function should not be able to access — say, a customers table — should return implicitDeny. If it returns allowed, something in your policy is broader than you intended, and the simulator caught it before it became a live permissions problem.

    If the result is explicitDeny for something your function needs, the block is upstream of the role — likely a Service Control Policy from your AWS Organization. Adding more permissions to the role will not fix it. The block needs to be addressed at the organization level, not the role level.


    Final Thoughts

    The pattern that causes the most problems in practice is not missing permissions — those fail loudly and are easy to fix. It is overly broad permissions that go unnoticed until something unexpected happens. A wildcard in the Resource field, a broad managed policy attached because it was convenient, a trust policy that allows more principals than necessary — these are the things worth spending an extra five minutes getting right the first time.

    • Wrong trust policy principal means the role can never be assumed by the intended service
    • Missing permissions fail at the specific call that needs them, not at startup
    • Missing CloudWatch Logs permissions make everything harder to debug without obvious errors
    • Permissions are additive across policies — an explicit deny overrides all of them
    • The simulator catches scope problems before they reach production

    The most expensive IAM mistake is not the one that breaks something — it is the one that quietly allows too much for too long before anyone notices.

  • Firebase to AWS migration

    Firebase to AWS migration

    Firebase is designed to get you moving fast. The SDKs are clean, the free tier is generous enough to build something real on, and you do not have to think about infrastructure at all. That is the point. The trade-off is that Firebase makes a lot of decisions for you, and at some point those decisions start costing you either money or flexibility — usually both at the same time.

    This guide is for teams who have already decided to move and want a clear path to do it. We will use a sensor data service as a running example throughout, but the migration steps apply broadly to any Firebase backend.


    Should You Actually Migrate?

    This is worth asking honestly before spending time on it. If you are on Firebase’s free Spark plan and your usage is comfortably within the limits, there is no immediate reason to move. The Spark plan gives you 1GB of Firestore storage, 50,000 document reads per day, and 20,000 writes per day. For a lot of small projects, that is enough.

    Where things change is when you cross into Blaze territory. Firebase’s Blaze plan is pay-as-you-go — there is no monthly cap, which means a sudden traffic spike or a misbehaving client can produce a bill you did not expect. More importantly, the per-operation pricing model means write-heavy workloads get expensive faster than storage-heavy ones.

    To put it in concrete terms: a sensor that writes a reading every 30 seconds produces about 2,880 writes per day by itself. Ten sensors exhaust the free write quota. A hundred sensors push you firmly into paid territory at $0.18 per 100,000 writes. At that point, migrating to AWS starts making economic sense — not because AWS is always cheaper, but because the cost structure is more predictable and the storage costs are lower at scale.

    Plan Firestore Storage Writes per Day Reads per Day Cost
    Firebase Spark (free) 1 GB 20,000 50,000 Free
    Firebase Blaze $0.18/GB/month $0.18 per 100K $0.06 per 100K Pay-as-you-go
    AWS DynamoDB (free tier) 25 GB 25 writes/second sustained 25 reads/second sustained Free (permanent)
    AWS DynamoDB (on-demand) $0.25/GB/month $1.25 per million $0.25 per million Pay-as-you-go

    One thing that surprises people: the AWS DynamoDB free tier is permanent, not a 12-month trial. 25GB of storage and 25 read/write capacity units stay free indefinitely. For our sensor example running 100 sensors at one reading every 30 seconds, that is about 3.3 writes per second — well within the free DynamoDB capacity. The same workload on Firebase would cost around $26/month on Blaze.


    Which AWS Service Should You Use?

    Firebase Firestore is a general-purpose document database. When you move to AWS, you have more choices, and the right one depends on how you access your data.

    AWS Service Best For Storage Cost
    Amazon DynamoDB Current state lookups, latest reading per device, low-latency queries by ID $0.25/GB/month
    Amazon Timestream Time-series queries, trends, aggregations over time ranges — purpose-built for sensor data $0.036/GB/month (magnetic)
    Amazon S3 + Athena Historical data, analytics, archival — cheapest long-term storage with SQL querying $0.023/GB/month
    AWS IoT Core + Timestream If devices use MQTT — IoT Core routes directly to Timestream without custom ingestion code Timestream rates apply

    For sensor data specifically, Timestream is worth serious consideration. It is a managed time-series database with automatic tiering — recent data lives in a memory store for fast queries, older data moves to magnetic storage automatically. The storage cost at $0.036/GB is dramatically lower than both Firestore and DynamoDB, which matters when you are storing years of high-frequency readings.

    A common pattern is to use both: DynamoDB holds the latest reading per device for real-time dashboard lookups, and Timestream or S3 holds the full history for analytics and reporting. This avoids expensive Firestore collection scans, which is often what drives up costs in the first place.


    Step 1: Export Your Data from Firebase

    The first step is getting your data out. Firebase supports managed Firestore exports directly to Google Cloud Storage via the gcloud CLI.

    gcloud firestore export gs://your-gcs-bucket/migration \ --collection-ids=your_collection

    This produces a set of export files in Google Cloud Storage. Once the export completes, transfer them to an S3 bucket. For smaller datasets, the gsutil cross-cloud copy works directly:

    gsutil -m cp -r gs://your-gcs-bucket/migration \ s3://your-aws-bucket/firestore-export

    For large exports over 50GB, use AWS DataSync with a GCS connector instead. It handles parallel transfer, retries, and progress tracking — manually copying tens of gigabytes over a CLI command is fragile and slow.

    The exported format is Firestore’s internal LevelDB format, not JSON. Before you can import it into DynamoDB or Timestream, you need to convert it. The most reliable approach is to write a short export script that reads your collections directly via the Firebase Admin SDK and produces newline-delimited JSON:

    const admin = require('firebase-admin'); const fs = require('fs');
    
    admin.initializeApp({ credential: admin.credential.applicationDefault() }); const db = admin.firestore();
    
    async function exportCollection(collectionName) { const snapshot = await db.collection(collectionName).get(); const output = fs.createWriteStream(`${collectionName}.ndjson`);
    
     snapshot.forEach(doc => { output.write(JSON.stringify({ id: doc.id, ...doc.data() }) + '\n'); });
    
     output.end(); console.log(`Exported ${snapshot.size} documents`); }
    
    exportCollection('sensor_readings');

    Upload the resulting .ndjson file to S3, and it becomes the source for your import.


    Step 2: Set Up Your AWS Destination

    If you are migrating to DynamoDB, create the table with a partition key that matches how you query your data. For sensor readings, that is typically the device ID.

    aws dynamodb create-table \ --table-name sensor-readings \ --attribute-definitions \ AttributeName=device_id,AttributeType=S \ AttributeName=timestamp,AttributeType=N \ --key-schema \ AttributeName=device_id,KeyType=HASH \ AttributeName=timestamp,KeyType=RANGE \ --billing-mode PAY_PER_REQUEST

    If you are migrating to Timestream, create a database and table with retention policies. The memory store retention controls how long data stays in the fast tier before moving to magnetic storage.

    aws timestream-write create-database \ --database-name freezesense
    
    aws timestream-write create-table \ --database-name freezesense \ --table-name readings \ --retention-properties \ MemoryStoreRetentionPeriodInHours=24,MagneticStoreRetentionPeriodInDays=365

    Step 3: Import Your Data

    With the exported .ndjson file in S3, write a Lambda function or a local script that reads it line by line and writes to your chosen AWS service. For DynamoDB, use batch writes to stay within rate limits and keep import costs low.

    import boto3 import json
    
    dynamodb = boto3.resource('dynamodb') table = dynamodb.Table('sensor-readings')
    
    with open('sensor_readings.ndjson', 'r') as f, table.batch_writer() as batch: for line in f: doc = json.loads(line) batch.put_item(Item={ 'device_id': doc['device_id'], 'timestamp': int(doc['timestamp']), 'temperature': str(doc['temperature']), 'humidity': str(doc['humidity']) })

    DynamoDB’s batch_writer automatically groups writes into batches of 25 and retries any unprocessed items. You do not need to implement retry logic yourself.


    Step 4: Update Your Application

    Remove the Firebase SDK and replace Firestore calls with the AWS SDK. The write path changes from a Firestore document set to a DynamoDB put item — or a Kinesis put record if you are routing writes through a stream.

    // Before — Firebase await db.collection('sensor_readings').add({ device_id: deviceId, timestamp: Date.now(), temperature: reading.temperature });
    
    // After — DynamoDB const client = new DynamoDBClient({ region: 'us-east-1' }); await client.send(new PutItemCommand({ TableName: 'sensor-readings', Item: { device_id: { S: deviceId }, timestamp: { N: String(Date.now()) }, temperature: { N: String(reading.temperature) } } }));

    Run both write paths simultaneously for at least 48 hours before removing Firebase. Compare document counts between Firestore and DynamoDB daily to confirm parity, and only remove the Firebase write path once you are satisfied the counts match.


    Final Thoughts

    The migration itself is straightforward once you have the export in hand. The harder decision is which AWS service to land on, and that is worth spending time on before writing any import code — moving data twice is more painful than choosing carefully the first time.

    If you are currently on Firebase’s free Spark plan and your workload fits within it, there is no urgency. But if you are approaching the Blaze plan or already on it and watching costs grow, the AWS free tier is meaningfully more generous for write-heavy workloads, and services like Timestream and S3 offer storage costs that Firestore cannot match at scale.

    The most important thing is not to rush the cutover. Export, import, run in parallel, verify the data, then cut. Doing it in that order takes longer but it means you always have a working system to fall back to if something does not go as planned.

  • Deploying a lambda function

    Deploying a lambda function

    Modern serverless architectures are built on the principle that infrastructure should scale automatically, respond to events in milliseconds, and eliminate the operational burden of managing servers. AWS Lambda sits at the center of that serverless model.

    A Lambda function is the deployed instance of executable code running inside AWS’s managed compute environment. The deployment package defines the function’s behavior, while the Lambda function resource represents the actual running compute unit created from that definition.

    Core Concept: The deployment package is the code. The Lambda function is the deployed, invokable compute unit.


    Understanding What Gets Deployed

    Every Lambda deployment begins with a deployment package. That package may be:

    • A .zip file archive containing function code and dependencies
    • A container image stored in Amazon ECR
    • Generated by AWS CDK using the NodejsFunction or Function construct
    • Produced through AWS SAM using the AWS::Serverless::Function resource type
    Tool What You Write What Lambda Receives
    AWS CDK TypeScript / Python / Java Synthesized CloudFormation + zipped function asset
    AWS SAM Serverless Template (YAML) Expanded CloudFormation + deployment package
    AWS CLI .zip file or S3 URI Directly uploaded deployment package

    Deploying a Lambda Function Using AWS CDK

    AWS CDK allows Lambda infrastructure to be written using real programming languages instead of verbose YAML templates. CDK bundles function code, uploads it to S3, and deploys it through CloudFormation automatically.

    Step 1: Initialize the CDK Application

    npm install -g aws-cdk
    
    mkdir lambda-demo
    cd lambda-demo
    
    cdk init app --language typescript

    Step 2: Define the Stack

    import * as cdk from 'aws-cdk-lib';
    import * as lambda from 'aws-cdk-lib/aws-lambda';
    import * as apigateway from 'aws-cdk-lib/aws-apigateway';
    import { NodejsFunction } from 'aws-cdk-lib/aws-lambda-nodejs';
    import * as path from 'path';
    
    export class LambdaDemoStack extends cdk.Stack {
    
      constructor(scope: cdk.App, id: string) {
        super(scope, id);
    
        const fn = new NodejsFunction(this, 'HelloFunction', {
          runtime: lambda.Runtime.NODEJS_22_X,
          entry: path.join(__dirname, '../lambda/handler.ts'),
          handler: 'handler',
          timeout: cdk.Duration.seconds(30),
          memorySize: 256,
          environment: {
            ENVIRONMENT: 'production'
          }
        });
    
        new apigateway.LambdaRestApi(this, 'HelloApi', {
          handler: fn
        });
      }
    }

    Step 3: Bootstrap the Environment

    cdk bootstrap

    This creates the bootstrap stack:

    CDKToolkit

    Step 4: Synthesize the Template

    cdk synth

    CDK bundles the function code using esbuild, uploads the .zip asset to the bootstrap S3 bucket, and converts constructs into a full CloudFormation template.

    Step 5: Deploy the Function

    cdk deploy

    What Happens During Deployment

    1. CDK packages function code into a .zip asset and uploads it to S3
    2. CloudFormation validates the template and resolves the S3 asset location
    3. The Lambda function resource is created with the specified runtime and memory
    4. Lambda provisions an execution environment for the function
    5. Rollback occurs automatically on failure

    Monitoring Function Events

    aws lambda get-function \
      --function-name LambdaDemoStack-HelloFunction

    Rollback Behavior

    If a function update fails midway through a CloudFormation-managed deployment, CloudFormation automatically rolls the stack back to its previous stable state.

    For debugging failed deployments without automatic rollback:

    cdk deploy --no-rollback

    Deploying Using the AWS CLI

    Create a Function

    aws lambda create-function \
      --function-name hello-function \
      --runtime python3.12 \
      --handler lambda_function.lambda_handler \
      --role arn:aws:iam::123456789012:role/lambda-execution-role \
      --zip-file fileb://deployment.zip \
      --timeout 30 \
      --memory-size 256

    Update Function Code

    aws lambda update-function-code \
      --function-name hello-function \
      --zip-file fileb://deployment.zip

    Delete a Function

    aws lambda delete-function \
      --function-name hello-function

    Deploying Through CI/CD Pipelines

    Publishing a Version

    aws lambda publish-version \
      --function-name hello-function \
      --description "Release v2 - added input validation"

    Publishing creates an immutable, numbered snapshot of the function’s code and configuration.


    Creating an Alias

    aws lambda create-alias \
      --function-name hello-function \
      --name production \
      --function-version 3 \
      --description "Production traffic"

    Aliases are named pointers to specific published versions, allowing triggers to reference a stable function endpoint that can be updated independently of version numbers.


    Canary Deployment

    aws lambda update-alias \
      --function-name hello-function \
      --name production \
      --function-version 3 \
      --routing-config AdditionalVersionWeights={"4"=0.10}

    Weighted alias routing splits live traffic between two published versions, enabling gradual rollouts with the ability to roll back by updating the alias pointer.


    Final Thoughts

    Lambda deployment is fundamentally about managing the lifecycle of executable code within a managed, event-driven compute environment.

    Whether a function is deployed through:

    • AWS CDK
    • AWS SAM
    • AWS CLI
    • Container Images via ECR
    • CI/CD Pipelines

    the underlying Lambda execution model remains the same.

    Understanding deployment package types, execution role requirements, version and alias management, and canary traffic shifting is what separates basic Lambda usage from production-grade serverless engineering.

  • Deploying a CloudFormation Stack

    Deploying a CloudFormation Stack

    Modern AWS infrastructure is expected to be reproducible, version-controlled, reviewable, and deployable through automation. AWS CloudFormation sits at the center of that operational model.

    A CloudFormation stack is the deployed instance of an infrastructure template. The template defines the desired state of AWS resources, while the stack represents the actual running infrastructure created from that definition.

    Core Concept: The template is the blueprint. The stack is the deployed infrastructure.


    Understanding What Gets Deployed

    Every deployment begins with a CloudFormation template. That template may be:

    • Written directly in YAML or JSON
    • Generated by AWS CDK
    • Expanded through AWS SAM transforms
    • Produced through automation pipelines
    Tool What You Write What CloudFormation Receives
    AWS CDK TypeScript / Python / Java Synthesized CloudFormation Template
    CloudFormation YAML / JSON Same Template
    AWS SAM Serverless Template Expanded CloudFormation Template

    Deploying Infrastructure Using AWS CDK

    AWS CDK allows infrastructure to be written using real programming languages instead of verbose YAML templates.

    Step 1: Initialize the CDK Application

    
    npm install -g aws-cdk
    
    mkdir ecs-demo
    cd ecs-demo
    
    cdk init app --language typescript


    Step 2: Define the Stack

    
    import * as cdk from 'aws-cdk-lib';
    import * as ecs from 'aws-cdk-lib/aws-ecs';
    import * as ec2 from 'aws-cdk-lib/aws-ec2';
    import * as ecs_patterns from 'aws-cdk-lib/aws-ecs-patterns';
    
    export class EcsDemoStack extends cdk.Stack {
    
      constructor(scope, id) {
        super(scope, id);
    
        const vpc = new ec2.Vpc(this, 'AppVpc');
    
        const cluster = new ecs.Cluster(this, 'AppCluster', {
          vpc
        });
    
        new ecs_patterns.ApplicationLoadBalancedFargateService(
          this,
          'AppService',
          {
            cluster,
            taskImageOptions: {
              image: ecs.ContainerImage.fromRegistry('nginx')
            }
          }
        );
      }
    }


    Step 3: Bootstrap the Environment

    
    cdk bootstrap


    This creates the bootstrap stack:

    
    CDKToolkit


    Step 4: Synthesize the Template

    
    cdk synth


    CDK converts application constructs into a full CloudFormation template.

    Step 5: Deploy the Stack

    
    cdk deploy


    What Happens During Deployment

    1. CloudFormation validates the template
    2. Dependencies between resources are resolved
    3. Resources are provisioned in parallel
    4. Stack events stream continuously
    5. Rollback occurs automatically on failure

    Monitoring Stack Events

    
    aws cloudformation describe-stack-events \
      --stack-name EcsDemoStack


    Rollback Behavior

    If resource creation fails midway, CloudFormation automatically rolls back the deployment.

    For debugging large deployments:

    
    cdk deploy --no-rollback


    Deploying Using the AWS CLI

    Create a Stack

    
    aws cloudformation create-stack \
      --stack-name networking-stack \
      --template-body file://vpc.yaml \
      --capabilities CAPABILITY_IAM


    Update a Stack

    
    aws cloudformation update-stack \
      --stack-name networking-stack \
      --template-body file://vpc.yaml


    Delete a Stack

    
    aws cloudformation delete-stack \
      --stack-name networking-stack


    Deploying Through CI/CD Pipelines

    Using Change Sets

    
    aws cloudformation create-change-set \
      --stack-name production-stack \
      --change-set-name v2-update \
      --template-body file://template.yaml


    Change sets preview infrastructure modifications before execution.


    Drift Detection

    
    aws cloudformation detect-stack-drift \
      --stack-name production-stack


    Drift detection identifies infrastructure modified outside CloudFormation.


    Termination Protection

    
    aws cloudformation update-termination-protection \
      --stack-name production-stack \
      --enable-termination-protection


    Termination protection prevents accidental deletion of production infrastructure.


    Final Thoughts

    CloudFormation deployment is fundamentally about managing infrastructure as a deterministic and reproducible system.

    Whether infrastructure is deployed through:

    • AWS CDK
    • Raw CloudFormation
    • AWS SAM
    • AWS CLI
    • CI/CD Pipelines

    the underlying CloudFormation engine remains the same.

    Understanding dependency resolution, rollback handling, resource stabilization, and stack lifecycle management is what separates basic AWS usage from production-grade infrastructure engineering.