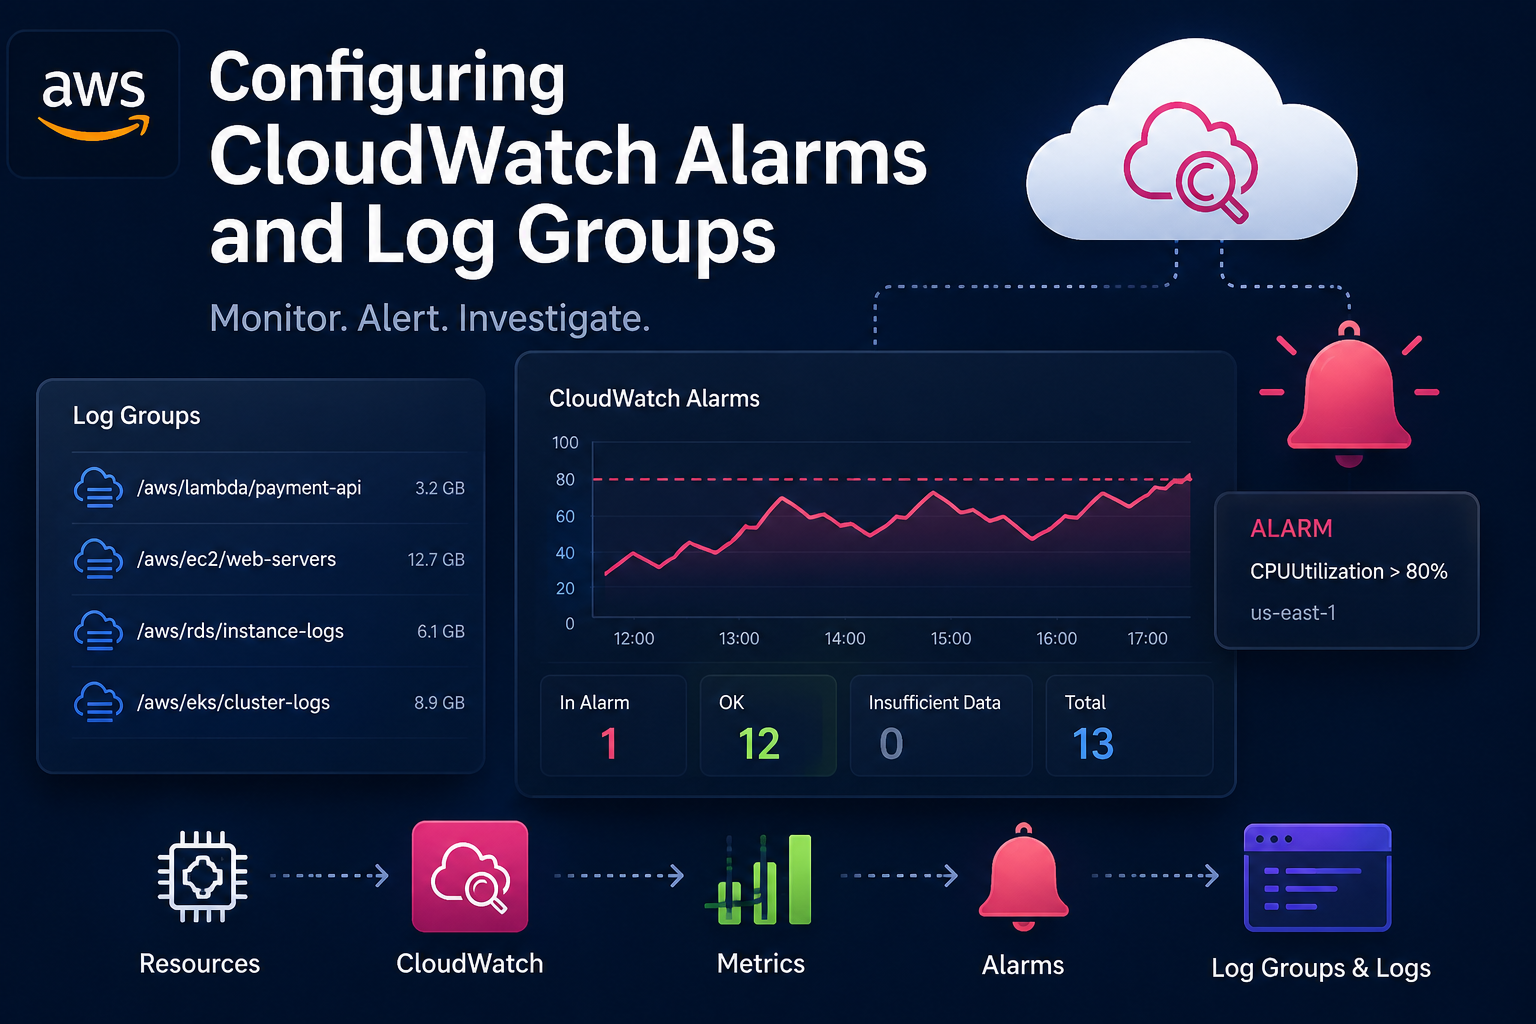
CloudWatch is the monitoring layer that most AWS workloads eventually depend on, whether the team planned for it or not. EC2 sends CPU metrics to it, Lambda writes logs to it, API Gateway exposes error rates through it, ECS services can be watched through it, and almost every production incident ends with someone opening CloudWatch to answer the same questions: what changed, when did it start, and why did nobody get alerted earlier?
Configuring CloudWatch alarms and log groups correctly is not complicated, but it is easy to leave half-finished. A log group gets created automatically with no retention policy. An alarm gets created with a threshold that looked reasonable at the time. Missing data is left at the default. Notifications are wired to a topic nobody is subscribed to. Everything looks fine until the first real outage, when the dashboard is quiet and the logs are expensive.
A production CloudWatch setup should do three things well: keep logs long enough to investigate problems, delete logs before they become a permanent bill, and alert on symptoms that actually matter. The setup below focuses on those basics.
Create Log Groups Intentionally
Many AWS services create CloudWatch log groups automatically. Lambda creates one when a function writes logs for the first time. API Gateway, ECS, Step Functions, and other services can also create or write to log groups depending on how logging is configured. Automatic creation is convenient, but it usually means the log group appears with default settings and no deliberate retention policy.
For production systems, create log groups intentionally before the service starts writing to them. That gives you control over the name, retention period, encryption, tags, and log class from the beginning.
aws logs create-log-group \
  --log-group-name /aws/app/orders-api \
  --region us-east-1
A consistent naming convention matters more than it looks. CloudWatch log groups become hard to manage when every service uses a different pattern. A useful convention is to include the platform, application, and environment:
/aws/app/orders-api/prod
/aws/app/orders-api/staging
/aws/lambda/payment-worker/prod
/aws/ecs/catalog-service/prod
/aws/apigateway/public-api/prod
If a log group already exists, the create command fails with a resource already exists error. That is not a problem. In infrastructure-as-code workflows, the log group should be managed by Terraform, CloudFormation, CDK, or whatever you use to keep production from becoming a collection of console clicks.
If you let a service create the log group automatically, go back immediately and apply retention, encryption, and tags. Automatic creation should not mean automatic neglect.
Set Retention Before Logs Accumulate
By default, CloudWatch Logs stores log data indefinitely. That sounds safe until a busy application starts writing debug logs, access logs, request payloads, stack traces, retries, and health check noise for months. Logs are useful during incidents, but old logs with no retention policy quietly become a storage bill.
Set a retention period on every production log group:
aws logs put-retention-policy \
  --log-group-name /aws/app/orders-api/prod \
  --retention-in-days 30 \
  --region us-east-1
The correct retention period depends on the workload. Application logs used for debugging might only need 14 or 30 days. Security, audit, and compliance logs might need 90 days, 180 days, one year, or longer. The important part is to choose deliberately instead of leaving the setting at never expire.
| Log Type | Common Retention | Reason |
|---|---|---|
| Application debug logs | 7-30 days | Useful for recent incidents, usually noisy after that |
| API access logs | 30-90 days | Useful for traffic analysis, abuse investigation, and debugging |
| Security or audit logs | 90-365+ days | Often driven by compliance and investigation requirements |
| Temporary development logs | 1-7 days | Should not become a permanent cost center |
| Archived incident logs | Export to S3 | Better suited for long-term retention and cheaper storage controls |
CloudWatch Logs does not always delete expired log events immediately when they reach the retention date. Deletion typically happens later, so do not assume the storage number drops the second you update the retention policy.
If you shorten retention from 365 days to 30 days, older events become eligible for deletion. If you change the setting back to a longer period before deletion finishes, some old data may remain longer than expected. For strict deletion requirements, keep the shorter retention setting in place until the old data has actually aged out.
Choose the Log Class Carefully
CloudWatch Logs supports log classes. The Standard class supports the full CloudWatch Logs feature set. Infrequent Access is lower-cost for logs that are accessed less often, but it supports only a subset of features. There is also a Delivery class used for delivering Lambda logs to Amazon S3 or Firehose, with limited CloudWatch Logs capabilities.
The important production detail is that the log class is chosen when the log group is created. After a log group is created, its class cannot be changed. That means this decision belongs in the setup step, not later when the bill arrives.
aws logs create-log-group \
  --log-group-name /aws/app/audit-events/prod \
  --log-group-class INFREQUENT_ACCESS \
  --region us-east-1
Use Standard when you need metric filters, subscription filters, real-time processing, Live Tail, Container Insights log ingestion, Lambda Insights log ingestion, or full operational visibility. Use Infrequent Access when logs are mostly kept for after-the-fact investigation and you do not need the unsupported features.
If you plan to create alarms from logs using metric filters, use Standard. Metric filters are not supported on Infrequent Access log groups. Creating the cheaper class first and discovering this later is a migration problem, not a setting change.
Encrypt Sensitive Log Groups With KMS
CloudWatch Logs encrypts log data by default, but production systems that handle regulated or sensitive data often need encryption with a customer managed KMS key. You can associate a KMS key with a log group so newly ingested data is encrypted with that key.
aws logs associate-kms-key \
  --log-group-name /aws/app/orders-api/prod \
  --kms-key-id arn:aws:kms:us-east-1:123456789012:key/11111111-2222-3333-4444-555555555555 \
  --region us-east-1
The KMS key policy must allow CloudWatch Logs to use the key. A typical key policy statement allows the regional CloudWatch Logs service principal to encrypt and decrypt data for the account. Replace the region, account ID, and key ARN with your actual values:
{
  "Sid": "AllowCloudWatchLogsUseOfKey",
  "Effect": "Allow",
  "Principal": {
    "Service": "logs.us-east-1.amazonaws.com"
  },
  "Action": [
    "kms:Encrypt",
    "kms:Decrypt",
    "kms:ReEncrypt*",
    "kms:GenerateDataKey*",
    "kms:DescribeKey"
  ],
  "Resource": "*",
  "Condition": {
    "ArnLike": {
      "kms:EncryptionContext:aws:logs:arn": "arn:aws:logs:us-east-1:123456789012:log-group:/aws/app/orders-api/prod"
    }
  }
}
If the key policy is wrong, log ingestion or log reading can fail. The symptom may look like the application is not logging, but the real issue is that CloudWatch Logs cannot use the key correctly. Test this early by writing a sample log event and reading it back.
If you associate a KMS key after logs already exist, newly ingested data uses the key. Existing data remains associated with whatever encryption configuration applied when it was written.
Create an SNS Topic Before the Alarm
An alarm without a working notification path is just a dashboard decoration. For most teams, the simplest starting point is an SNS topic with email, Slack, PagerDuty, Opsgenie, or another incident tool subscribed to it.
aws sns create-topic \
  --name production-alerts \
  --region us-east-1
Subscribe an email address while testing:
aws sns subscribe \
  --topic-arn arn:aws:sns:us-east-1:123456789012:production-alerts \
  --protocol email \
  --notification-endpoint [email protected] \
  --region us-east-1
The email subscription must be confirmed before notifications are delivered. This is one of the easiest things to miss. The alarm can be perfect, the SNS topic can be correct, and the notification can still go nowhere because the subscription is pending confirmation.
If your team uses an incident management tool, connect SNS to that tool instead of relying on a shared inbox. Email is fine for low-priority alerts. It is usually not enough for incidents that need someone awake and responding.
Create a Basic Metric Alarm
A CloudWatch alarm watches a metric and changes state when the metric breaches the configured threshold. The three alarm states are OK, ALARM, and INSUFFICIENT_DATA. The alarm evaluates metric datapoints over one or more periods and changes state based on the threshold, comparison operator, evaluation periods, datapoints to alarm, and missing data behavior.
A common EC2 alarm watches average CPU utilization for a specific instance:
aws cloudwatch put-metric-alarm \
  --alarm-name prod-web-01-high-cpu \
  --alarm-description "EC2 CPU utilization is above 80% for 10 minutes" \
  --namespace AWS/EC2 \
  --metric-name CPUUtilization \
  --dimensions Name=InstanceId,Value=i-0123456789abcdef0 \
  --statistic Average \
  --period 300 \
  --evaluation-periods 2 \
  --datapoints-to-alarm 2 \
  --threshold 80 \
  --comparison-operator GreaterThanThreshold \
  --treat-missing-data notBreaching \
  --alarm-actions arn:aws:sns:us-east-1:123456789012:production-alerts \
  --ok-actions arn:aws:sns:us-east-1:123456789012:production-alerts \
  --region us-east-1
This alarm uses a five-minute period and requires two out of two datapoints to breach. In practice, that means CPU must remain above 80% for about ten minutes before the alarm moves to ALARM. A single short spike will not trigger it.
If the workload is latency sensitive, ten minutes may be too slow. If the metric is naturally noisy, ten minutes may be too fast. The threshold should come from normal operating behavior, not a random number that looks serious.
For Lambda, an error alarm might look like this:
aws cloudwatch put-metric-alarm \
  --alarm-name prod-payment-worker-errors \
  --alarm-description "Lambda payment worker has errors" \
  --namespace AWS/Lambda \
  --metric-name Errors \
  --dimensions Name=FunctionName,Value=payment-worker-prod \
  --statistic Sum \
  --period 300 \
  --evaluation-periods 1 \
  --datapoints-to-alarm 1 \
  --threshold 0 \
  --comparison-operator GreaterThanThreshold \
  --treat-missing-data notBreaching \
  --alarm-actions arn:aws:sns:us-east-1:123456789012:production-alerts \
  --region us-east-1
This alarm triggers when Lambda reports more than zero errors in a five-minute period. That may be appropriate for payment processing. It may be too noisy for a batch job that retries safely. The same AWS service metric can require different alarm settings depending on the business impact.
Understand Evaluation Periods and Datapoints to Alarm
The two fields that decide how quickly an alarm triggers are EvaluationPeriods and DatapointsToAlarm. Together, they define an M out of N alarm.
If both values are the same, every datapoint in the evaluation window must breach. If EvaluationPeriods is 3 and DatapointsToAlarm is 3, the alarm needs three consecutive breaching datapoints.
If DatapointsToAlarm is lower than EvaluationPeriods, the alarm can tolerate some non-breaching datapoints. If EvaluationPeriods is 5 and DatapointsToAlarm is 3, the alarm triggers when three of the last five datapoints breach.
aws cloudwatch put-metric-alarm \
  --alarm-name prod-api-5xx-rate \
  --alarm-description "API has sustained 5xx errors" \
  --namespace AWS/ApiGateway \
  --metric-name 5XXError \
  --dimensions Name=ApiName,Value=public-api Name=Stage,Value=prod \
  --statistic Sum \
  --period 60 \
  --evaluation-periods 5 \
  --datapoints-to-alarm 3 \
  --threshold 10 \
  --comparison-operator GreaterThanThreshold \
  --treat-missing-data notBreaching \
  --alarm-actions arn:aws:sns:us-east-1:123456789012:production-alerts \
  --region us-east-1
This is useful for noisy metrics. Three bad minutes out of five is usually more meaningful than one bad minute, but it still catches a real problem faster than waiting for five consecutive bad datapoints.
If you are alerting on something that should never happen, such as payment failures, one datapoint may be enough. If you are alerting on saturation, such as CPU, memory, queue depth, or connection count, require multiple datapoints so transient spikes do not page people unnecessarily.
Handle Missing Data Deliberately
Missing data is one of the most important alarm settings because not every metric publishes continuously. Some metrics only appear when there is activity. Some custom metrics stop reporting when the application breaks. Some AWS service metrics are sparse by design.
CloudWatch supports these missing data options:
| Setting | Meaning | Typical Use |
|---|---|---|
breaching |
Treat missing datapoints as bad | Heartbeat metrics that must always report |
notBreaching |
Treat missing datapoints as good | Error metrics that only publish when errors happen |
ignore |
Keep the current alarm state | Metrics where missing data should not change state |
missing |
Use CloudWatch default missing-data behavior | Only when you have verified it fits the metric |
For an error-count metric, notBreaching is often correct. If there are no errors, some services may publish no datapoint. You do not want the alarm to enter ALARM just because nothing bad happened.
For a heartbeat metric, breaching is usually correct. If your application publishes Heartbeat=1 every minute and that metric disappears, the missing datapoint is the incident.
aws cloudwatch put-metric-alarm \
  --alarm-name prod-worker-heartbeat-missing \
  --alarm-description "Worker heartbeat stopped reporting" \
  --namespace Custom/App \
  --metric-name WorkerHeartbeat \
  --dimensions Name=Service,Value=payment-worker Name=Environment,Value=prod \
  --statistic Minimum \
  --period 60 \
  --evaluation-periods 3 \
  --datapoints-to-alarm 3 \
  --threshold 1 \
  --comparison-operator LessThanThreshold \
  --treat-missing-data breaching \
  --alarm-actions arn:aws:sns:us-east-1:123456789012:production-alerts \
  --region us-east-1
If this alarm uses notBreaching, it can fail silently when the worker dies and stops publishing metrics. That is the exact failure mode a heartbeat alarm is supposed to catch.
For DynamoDB metrics, be careful with assumptions. CloudWatch alarms that evaluate metrics in the AWS/DynamoDB namespace always ignore missing data even if you choose a different setting. That behavior matters when designing alarms around sparse DynamoDB metrics.
Build Alarms From Logs With Metric Filters
Not every useful signal exists as a built-in CloudWatch metric. Sometimes the important event is only visible in application logs: a payment failed, a downstream provider timed out, a user received a 403, or a background job retried too many times.
Metric filters turn matching log events into CloudWatch metrics. Once the metric exists, you can alarm on it like any other metric.
For example, assume the application logs JSON events like this:
{
  "level": "error",
  "service": "orders-api",
  "event": "checkout_failed",
  "reason": "payment_provider_timeout",
  "requestId": "8d42f9"
}
Create a metric filter that counts checkout failures:
aws logs put-metric-filter \
  --log-group-name /aws/app/orders-api/prod \
  --filter-name checkout-failures \
  --filter-pattern '{ $.event = "checkout_failed" }' \
  --metric-transformations \
    metricName=CheckoutFailures,\
metricNamespace=AWSBuilds/Orders,\
metricValue=1,\
defaultValue=0 \
  --region us-east-1
Then create an alarm on the generated metric:
aws cloudwatch put-metric-alarm \
  --alarm-name prod-orders-checkout-failures \
  --alarm-description "Checkout failures detected in application logs" \
  --namespace AWSBuilds/Orders \
  --metric-name CheckoutFailures \
  --statistic Sum \
  --period 300 \
  --evaluation-periods 1 \
  --datapoints-to-alarm 1 \
  --threshold 0 \
  --comparison-operator GreaterThanThreshold \
  --treat-missing-data notBreaching \
  --alarm-actions arn:aws:sns:us-east-1:123456789012:production-alerts \
  --region us-east-1
This pattern is useful when the application already logs the event but does not publish a custom metric. It lets you create operational signals without changing application code immediately.
Metric filters apply as log data is sent to CloudWatch Logs. They are not a replacement for searching historical logs. If you create the metric filter after yesterday’s incident, it will not backfill a metric for yesterday’s logs. Use Logs Insights for historical investigation and metric filters for ongoing monitoring.
Avoid High-Cardinality Metric Filter Dimensions
Metric filters can publish dimensions from JSON or space-delimited log events. Dimensions are useful, but they can also create a cost problem if the dimension value has too many unique values.
This is safe because environment has a small number of possible values:
aws logs put-metric-filter \
  --log-group-name /aws/app/orders-api/prod \
  --filter-name api-errors-by-environment \
  --filter-pattern '{ $.level = "error" }' \
  --metric-transformations \
    metricName=ApplicationErrors,\
metricNamespace=AWSBuilds/Orders,\
metricValue=1,\
dimensions='{Environment=$.environment}' \
  --region us-east-1
This is risky because request IDs are unique:
aws logs put-metric-filter \
  --log-group-name /aws/app/orders-api/prod \
  --filter-name api-errors-by-request-id \
  --filter-pattern '{ $.level = "error" }' \
  --metric-transformations \
    metricName=ApplicationErrors,\
metricNamespace=AWSBuilds/Orders,\
metricValue=1,\
dimensions='{RequestId=$.requestId}' \
  --region us-east-1
Each unique dimension value can become a separate custom metric. Do not use request IDs, user IDs, IP addresses, session IDs, order IDs, or other high-cardinality values as metric dimensions. Use those fields in Logs Insights queries instead.
If CloudWatch Logs sees a metric filter generating too many different dimension name-value pairs, it can disable the filter to prevent unexpected charges. That guard helps, but it is better to design the metric correctly in the first place.
Use Logs Insights for Investigation
Alarms tell you something is wrong. Logs tell you what happened. CloudWatch Logs Insights is useful for querying log groups during an incident without exporting logs somewhere else first.
A basic query for recent errors:
fields @timestamp, @message
| filter level = "error"
| sort @timestamp desc
| limit 50
A query to count errors by reason:
fields @timestamp, reason
| filter level = "error"
| stats count(*) as errors by reason
| sort errors desc
A query to inspect slow requests if your logs include duration:
fields @timestamp, path, statusCode, durationMs
| filter durationMs > 1000
| sort durationMs desc
| limit 50
You can start a Logs Insights query from the AWS CLI. Use epoch timestamps for the start and end time:
aws logs start-query \
  --log-group-name /aws/app/orders-api/prod \
  --start-time 1735689600 \
  --end-time 1735693200 \
  --query-string 'fields @timestamp, @message | filter level = "error" | sort @timestamp desc | limit 50' \
  --region us-east-1
Then fetch the results using the returned query ID:
aws logs get-query-results \
  --query-id 12345678-1234-1234-1234-123456789012 \
  --region us-east-1
Do not try to turn every investigation query into an alarm. Some queries are useful during debugging but too noisy for paging. Alarms should represent symptoms that need action. Logs Insights should help answer the follow-up questions.
Test the Alarm Path
After creating alarms, test the notification path. CloudWatch provides a way to temporarily set an alarm state. This is useful for confirming that the alarm action reaches SNS and that SNS reaches the actual recipient.
aws cloudwatch set-alarm-state \
  --alarm-name prod-web-01-high-cpu \
  --state-value ALARM \
  --state-reason "Testing alarm notification path" \
  --region us-east-1
This can trigger the alarm action. Use it carefully on alarms that perform operational actions such as stopping, rebooting, recovering, or scaling resources. For notification-only alarms, it is a practical way to confirm the full path works.
After testing, CloudWatch reevaluates the alarm based on the real metric data and moves it back to the correct state. Do not use manual state changes as a long-term override. If an alarm is noisy, fix the alarm configuration.
Check the alarm after creation:
aws cloudwatch describe-alarms \
  --alarm-names prod-web-01-high-cpu \
  --region us-east-1
Check the SNS subscriptions too:
aws sns list-subscriptions-by-topic \
  --topic-arn arn:aws:sns:us-east-1:123456789012:production-alerts \
  --region us-east-1
If the alarm enters ALARM but nobody receives a message, check whether the subscription is confirmed, whether the alarm action ARN is correct, whether the topic policy allows publishing, and whether the notification system connected to SNS is filtering or dropping the message.
Tag Log Groups and Alarms
Tags make CloudWatch resources easier to find, allocate costs, and control through IAM. At minimum, tag production log groups and alarms with application, environment, owner, and managed-by values.
aws logs tag-resource \
  --resource-arn arn:aws:logs:us-east-1:123456789012:log-group:/aws/app/orders-api/prod \
  --tags Application=orders-api,Environment=prod,Owner=platform,ManagedBy=terraform \
  --region us-east-1
For alarms, use tags when creating or updating them through infrastructure-as-code. If you manage alarms manually, tagging is still worth doing because the account will eventually have more alarms than anyone remembers creating.
aws cloudwatch tag-resource \
  --resource-arn arn:aws:cloudwatch:us-east-1:123456789012:alarm:prod-web-01-high-cpu \
  --tags Key=Application,Value=orders-api Key=Environment,Value=prod Key=Owner,Value=platform \
  --region us-east-1
If different teams share the same AWS account, tags become even more important. They let you answer basic questions quickly: who owns this alarm, which service writes to this log group, and can this be deleted?
Common Failure Modes
The most common CloudWatch mistake is creating an alarm that technically works but does not represent user impact. CPU above 80% is not always an incident. A queue growing for five minutes might be normal during a batch run. A single Lambda error might be expected if the function retries successfully. Alert on symptoms that require action.
The second common mistake is missing data behavior. If a metric only reports when something happens, treating missing data as breaching can create false alarms. If a metric must always report, treating missing data as not breaching can hide an outage.
The third mistake is leaving log groups without retention. This does not break production immediately, which is why it survives. It shows up later as cost growth that nobody can tie to one deploy.
The fourth mistake is relying only on log alarms. Logs are useful, but built-in service metrics are usually more direct for availability and saturation. Use service metrics for the main alarm path and log-based metrics for business events or application-specific failures.
The fifth mistake is not testing the notification path. An alarm that points to an SNS topic with no confirmed subscription is not an alarm. It is an optimistic configuration file.
Final Thoughts
CloudWatch does not need an elaborate setup to be useful. It needs a deliberate one. Create log groups with names that make sense. Set retention before logs pile up. Pick the log class based on features, not just price. Encrypt sensitive log groups with KMS when required. Create alarms that match real failure modes. Treat missing data based on the metric’s behavior. Test the notification path before an incident tests it for you.
A practical production baseline looks like this:
- Create important log groups before services start writing to them
- Apply retention to every log group
- Use Standard log class when you need metric filters or real-time log features
- Use Infrequent Access only for logs that do not need the unsupported features
- Use KMS encryption for sensitive or regulated log data
- Create SNS topics and confirm subscriptions before wiring alarms
- Use M out of N alarms to reduce noise on spiky metrics
- Set missing data behavior intentionally for every alarm
- Use metric filters for important application events found in logs
- Avoid high-cardinality dimensions in custom metrics
- Test alarm notifications after deployment
The best CloudWatch setup is the one that tells you about real problems early, keeps enough logs to investigate them, and deletes everything else before it becomes a bill nobody wants to explain.